- Ryan McDowell

- Dec 16, 2025
- 17 min read
Reading Time: 8 min | Good for: Novice Investors (A), Informed Principals (B)
TL;DR: Key Takeaways on 1031 Exchanges
What It Is: A 1031 exchange allows you to sell an investment property and defer all capital gains taxes by reinvesting the proceeds into a new "like-kind" property.
Who Should Care: Any real estate investor looking to grow their portfolio without the immediate tax drag, enabling faster capital compounding.
Why It Matters Now: In a market where maximizing every dollar of equity is crucial, a 1031 exchange is a powerful tool for repositioning assets, increasing cash flow, or moving into different property types or geographies without a tax penalty.
Next Step: Understand the strict rules—especially the 45-day identification and 180-day closing deadlines—and assemble your team (QI, CPA, attorney) before you sell.
A 1031 tax-deferred exchange is one of the most powerful wealth-building tools in a real estate investor's arsenal. It’s a provision in Section 1031 of the U.S. Internal Revenue Code that lets you sell one investment property and roll the full proceeds into a new one, all while putting your capital gains tax bill on hold.
Think of it as hitting the upgrade button on your portfolio without having to stop and write a check to the IRS. This allows your capital to keep compounding, uninterrupted.

Why Now? The Market Context for Strategic Exchanges
Even in a shifting market, savvy investors continue to see the value in strategic portfolio management. Many high-net-worth individuals and family offices are actively using 1031 exchanges to optimize their real estate holdings. According to a 2021 study by Ernst & Young, like-kind exchanges supported an estimated $55.3 billion in U.S. GDP, demonstrating their significant role in driving investment and capital formation. The ability to defer taxes allows investors to redeploy 100% of their equity, providing substantially more buying power to acquire higher-quality assets or diversify into more resilient sectors.
Unlocking Your Portfolio’s Potential
At its heart, a 1031 exchange is a strategy for perpetual motion in your investments. Instead of cashing out and taking a significant tax hit on your property’s appreciation, you get to push the full value of your investment forward into the next deal.
This move preserves capital that would otherwise vanish into taxes, dramatically boosting your buying power for the next acquisition. It’s a game-changer for savvy investors looking to pivot their portfolios, whether that means boosting cash flow, diversifying into new markets, or getting out of management-intensive properties.
For example, an investor could exchange a portfolio of high-maintenance single-family rentals for a single, top-tier medical office building or even a passive stake in a large multifamily development. The possibilities are vast.
To really get a feel for how a 1031 exchange works, it helps to first understand the types of assets involved. You can find useful investment property details to help build that foundational knowledge.
The Power of Uninterrupted Compounding
The real magic here is letting your real estate investments grow without the constant drag of taxes. Let’s say you have an asset with a $1 million capital gain. A normal sale could trigger a tax bill of $200,000 to $300,000, depending on your federal and state rates. With a 1031 exchange, every single dollar of that gain stays invested and working for you.
Investor Take: A 1031 exchange isn't about avoiding taxes; it's about deferring them. The classic strategy is to "swap 'til you drop," continuously exchanging properties throughout your life. When you pass away, your heirs may inherit the property with a stepped-up basis, which can potentially wipe out the deferred tax liability for good.
1031 Exchange Core Concepts at a Glance
For anyone new to this powerful tool, here’s a quick rundown of the fundamental pieces. Nailing these down is the first step to pulling off a seamless exchange and keeping your returns on track.
Component | Brief Explanation | Why It Matters for Investors |
|---|---|---|
Like-Kind Property | You must swap real property held for investment or business for other real property held for the same purpose. The specific type of property (like raw land for an apartment building) can be different. | This rule is incredibly flexible. It lets you pivot from one asset class to another—say, from retail to industrial—to chase market trends without triggering a tax event. |
Qualified Intermediary (QI) | This is an independent third party who holds your sale proceeds during the exchange. You are strictly forbidden from touching the money, even for a moment. | Using a QI is absolutely non-negotiable. It's an IRS safe harbor rule that keeps your exchange compliant. Skipping this step will disqualify the entire transaction, making it instantly taxable. |
Strict Timelines | You get 45 days from the sale of your old property to formally identify potential replacement properties. You then have a total of 180 days from that same sale date to close on one of them. | These deadlines are set in stone and have no grace period. If you miss one, the exchange fails. This makes planning ahead and having a solid team absolutely critical. |
Value & Equity Rules | To defer all taxes, the property you buy must have a value and debt equal to or greater than the one you sold. You must also reinvest all of your equity. | This forces you to "trade up" or at least sideways, ensuring the full investment is rolled forward. Pulling cash out or taking on less debt will create a taxable event known as "boot." |
Understanding these core rules is what separates a successful tax-deferred strategy from a costly mistake. With the right guidance, a 1031 exchange can become a cornerstone of your long-term wealth-building plan.
The Three Pillars of a Successful 1031 Exchange
To pull off a successful 1031 tax-deferred exchange, there are a few foundational rules you absolutely must follow. These aren't just helpful suggestions; they're the structural pillars holding the entire deal together. Getting a firm grip on them is the first real step toward protecting your capital and making smart, strategic moves with your real estate portfolio.
Think of it as a powerful, but very specific, agreement you have with the IRS. Follow the rules to the letter, and you unlock the ability to defer some serious tax liabilities. But one wrong move on any of them can bring the whole structure crashing down, leaving you with an immediate and often hefty tax bill.
These principles have been around for a while. The basic idea of a like-kind exchange actually dates all the way back to the Revenue Act of 1921. However, the modern framework we use today—with its strict timelines and the required use of third-party facilitators—was really hammered out in court cases and IRS regulations through the 1980s and 90s. You can find more insights into the history of the 1031 exchange on realized1031.com.
Pillar 1: The Like-Kind Property Rule
The term "like-kind" is probably one of the most misunderstood parts of a 1031 exchange, but it’s also incredibly flexible. It does not mean you have to trade an apartment building for another apartment building.
Instead, "like-kind" is about the nature of the property, not its grade or quality. When it comes to real estate, this means you can exchange almost any type of U.S. property held for business or investment for any other U.S. real property held for the same purpose.
This flexibility opens up a world of possibilities for investors. For example, you can exchange:
Raw land for a fully developed retail center.
A portfolio of single-family rentals for an interest in an institutional-grade apartment complex.
An office building for an industrial warehouse.
The crucial part is that both the property you sell (the "relinquished" property) and the one you buy (the "replacement" property) must be for investment or business use. Your primary residence or a personal vacation home simply won't qualify.
Pillar 2: Held for Investment or Business Use
This second pillar is a direct extension of the first. The IRS needs to see a clear and provable intent that both properties in the exchange are part of your investment strategy or business operations, not for your personal enjoyment.
While the IRS doesn't specify an exact holding period, a good rule of thumb is to hold a property for at least 24 months to convincingly show your investment intent. If you sell too quickly after completing an exchange, it could raise a red flag and put the entire deferral at risk. Your actions need to match the spirit of the tax code, which is all about encouraging continuous investment in business and income-producing assets.
Pillar 3: The Qualified Intermediary Mandate
This might be the most critical and unforgiving rule of all. During the exchange process, you cannot have actual or constructive receipt of the sales proceeds from your relinquished property. If you so much as touch the funds, the exchange is busted, and the entire transaction becomes a fully taxable sale.
To make sure this doesn't happen, you are required to use a Qualified Intermediary (QI), who is also sometimes called an Accommodator or Facilitator.
A Qualified Intermediary is an independent third party whose job is to securely hold your funds in escrow between the sale of your old property and the purchase of your new one. They act as the essential safe harbor that keeps your exchange compliant with IRS regulations.
Hiring a QI isn't optional—it's mandatory for any valid delayed exchange, and you have to get them on board before you close the sale of your property. The QI drafts the legal documents that instruct the closing agent to send the funds directly to them, ensuring you stay at a necessary arm's length from the capital. This legal separation is the bedrock of a successful 1031 tax-deferred exchange.
Mastering the Inflexible 1031 Exchange Timeline
Of all the moving parts in a 1031 exchange, the timeline is the most critical—and honestly, the most stressful. It’s rigid, it's unforgiving, and it's the number one reason some exchanges fall apart. Getting these deadlines right isn’t just important; it’s the key to protecting your capital and making the deal work.
The clock starts ticking the second your relinquished property sale closes. From that day forward, two deadlines are triggered at the same time. These are measured in calendar days, meaning weekends and holidays count against you. There are absolutely no extensions.
This strict structure has evolved over decades, from the Revenue Act of 1921 to today’s tight regulations, all designed to ensure a continuous, structured investment flow.
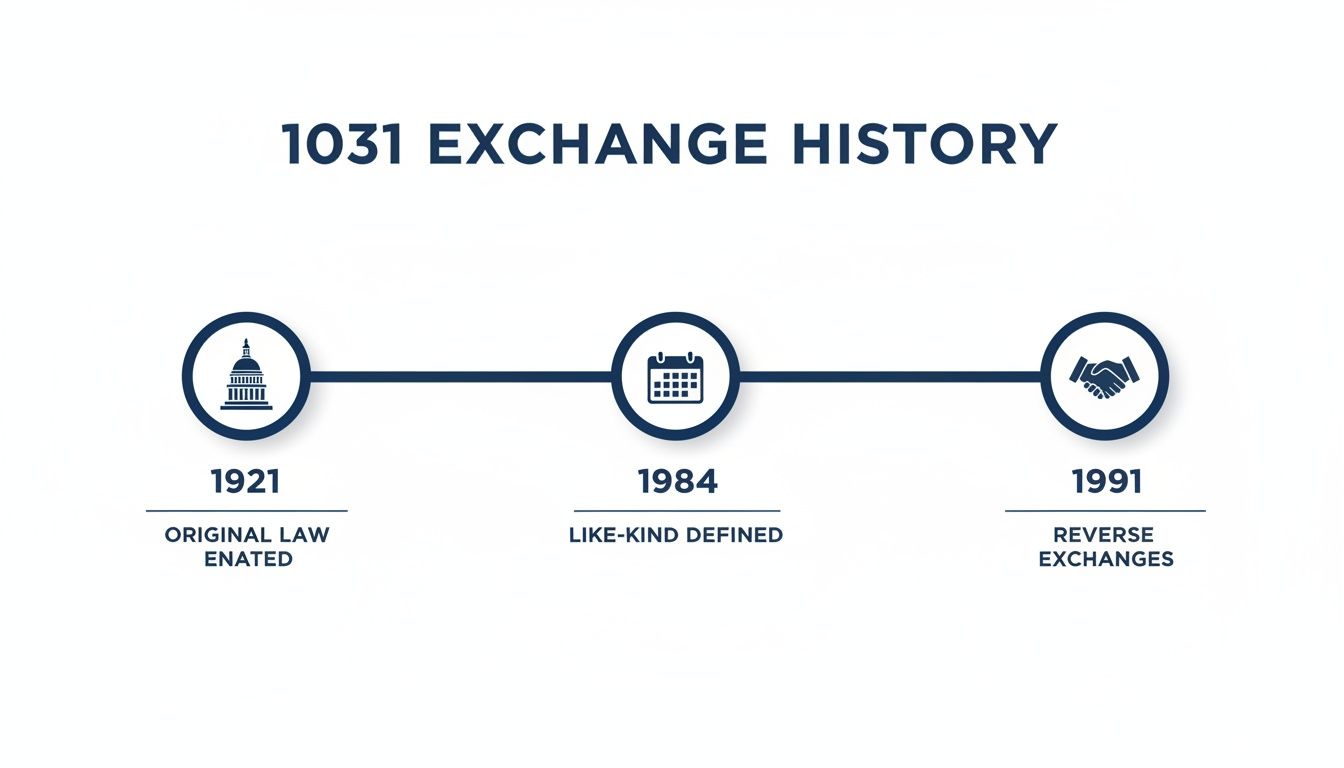
This history shows just how far the 1031 exchange has come, from a simple concept to the highly regulated process investors must master today.
The 45-Day Identification Period
You have exactly 45 days from the day you close your sale to formally identify potential replacement properties. This isn't a casual list—it must be a signed, written document delivered to your Qualified Intermediary (QI). You can't be vague; you must "unambiguously" describe the properties, usually with a street address or legal description.
Miss this deadline by a single day, and the entire exchange is toast. This is exactly why smart investors start scouting for replacement assets long before their current property is even on the market.
The 180-Day Closing Period
The second deadline gives you a total of 180 days from your original closing date to actually acquire one or more of the properties you identified. The key thing to remember is that this period includes the initial 45-day window. Once your identification period ends, you have the remaining 135 days to get everything else done: due diligence, financing, and closing the purchase.
For a step-by-step breakdown of the entire process, check out our guide on how to do a 1031 exchange for investors.
These two clocks don't run one after the other—they run at the same time, demanding focused action from day one.
Navigating the Identification Rules
Within that 45-day window, the IRS gives you three ways to identify properties. You only need to follow one of these rules.
The Three-Property Rule: This is the most common and straightforward path. You can identify up to three potential replacement properties, regardless of their value. You don't have to buy all of them—the goal is just to successfully close on at least one.
The 200% Rule: If you want to identify more than three properties, you can, but there's a catch. The total fair market value of all identified properties can't exceed 200% of what you sold your property for. This rule is perfect for investors looking to trade one large asset for several smaller ones.
The 95% Rule: This one is the riskiest and least common. You can identify as many properties as you want, but you must ultimately close on at least 95% of the total value of everything you identified. If even one small deal falls through, it could blow up the entire exchange.
Deal Lens Example (Illustrative): An investor sells an industrial warehouse for $2 million. Within 45 days, they identify three potential replacements: a medical office building for $2.2 million, a small multifamily complex for $2.5 million, and a retail center for $1.9 million. After finishing due diligence, they decide the medical office building is the best fit and close on it well within the 180-day window, completing a perfect, fully tax-deferred exchange.
Understanding Your Tax Exposure: Boot, Basis, and Depreciation
To get the most out of a 1031 tax-deferred exchange, you have to get your head around a few key financial concepts that dictate your ultimate tax bill. While the big prize is deferring taxes, a few missteps can trigger a taxable event or change the financial DNA of your new asset. Mastering the mechanics of boot, basis, and depreciation is what really separates a good exchange from a great one.
Think of these concepts as the engine room of the 1031 exchange. They determine how much tax you owe now (if any) and how your new investment will perform from a tax standpoint down the road. Getting this part right is absolutely critical for preserving your capital and boosting your long-term returns.

Defining and Avoiding Taxable "Boot"
In the lingo of 1031 exchanges, "boot" is anything you receive in the deal that isn't "like-kind" property. It's the part of the transaction that doesn't qualify for tax deferral, making it immediately taxable up to the amount of your total gain. Just picture it as the cash or value that "leaks" out of an otherwise sealed exchange.
Boot can sneak into a deal in a couple of ways, often catching inexperienced investors by surprise. The two most common culprits are:
Cash Boot: This one’s simple. If you pocket any cash from the sale proceeds held by your Qualified Intermediary, that cash is boot. It's taxable.
Mortgage Boot (or Debt Relief): This happens when the mortgage on your new replacement property is less than the mortgage you carried on the old relinquished property. The difference—the debt you were relieved of—is treated as taxable boot.
Investor Take: Want a completely tax-free exchange? The formula is simple. Reinvest all your equity, and buy a new property with debt that's equal to or greater than your old debt. Any time you stray from that, you're likely creating some taxable boot for yourself.
A real-world exchange can get complicated, with different types of boot sometimes offsetting each other. But not always. The table below breaks down how these scenarios typically play out.
Taxable Events in a 1031 Exchange
Scenario | Description | Tax Implication |
|---|---|---|
Fully Deferred Exchange | All sale proceeds are reinvested, and the new property has equal or greater debt. | No tax due. All capital gains and depreciation recapture are deferred. |
Receiving Cash Boot | The investor pockets some of the sale proceeds instead of reinvesting them. | The cash received is taxable up to the total gain on the sale. |
Receiving Mortgage Boot | The investor acquires a new property with less debt than the property they sold. | The amount of debt relief is considered boot and is taxable. |
Partial Exchange | The replacement property costs less than the relinquished property, leaving cash left over. | The uninvested cash is treated as boot and is immediately taxable. |
As you can see, the path to full tax deferral is narrow. Any deviation that results in you receiving cash or reducing your debt load will likely trigger a tax bill.
How Your Tax Basis Carries Over
The magic behind a 1031 exchange's tax deferral power is the carryover basis. Instead of your new property getting a fresh tax basis equal to its purchase price, the basis from your old property simply rolls over to the new one.
This is the very reason the tax is deferred, not completely wiped out. The gain you're not paying taxes on today is essentially embedded in the lower basis of your new property, waiting for a future sale.
Let's walk through a quick example:
You sell a property for $1,000,000.
Your original adjusted basis in that property was $400,000.
You use a 1031 exchange to buy a new property for $1,200,000.
In a normal transaction, your basis in the new property would be its $1,200,000 purchase price. But in a 1031, you calculate it by taking the new property's price and subtracting the deferred gain ($600,000). So, your new basis is just $600,000 ($1,200,000 - $600,000), carrying that deferred tax liability forward.
The Deal with Depreciation Recapture
Depreciation is a fantastic benefit for real estate investors, letting you write off a piece of a property's cost each year to lower your taxable income. But when you sell, the IRS wants to "recapture" the taxes you saved from all those deductions. This is called depreciation recapture, and it’s taxed at a special, higher rate—up to 25%—which is often more than long-term capital gains rates.
A huge advantage of a 1031 exchange is that it defers both capital gains tax and this nasty depreciation recapture tax. As long as you execute a clean exchange, that entire tax bill gets kicked down the road. To get a better handle on this powerful tool, check out our deep dive on depreciation tax shields.
Here's the catch: if you do receive boot in your exchange, the IRS has a specific ordering rule. Your taxable gain is first considered to be from depreciation recapture. This means any boot you receive will be taxed at those higher recapture rates first, before any of it is treated as a capital gain. It’s another powerful reason to structure your exchange to be as clean and boot-free as possible.
Exploring Different Types of 1031 Exchanges
While the standard delayed exchange is the most common path investors take, it's far from the only game in town. The IRS has thankfully provided several other structures to fit different real-world investment scenarios, giving savvy investors some much-needed flexibility.
Understanding these variations can unlock strategic opportunities that a simple, by-the-book exchange just can't accommodate. Each type is really a solution to a specific problem—from finding the perfect property before you sell, to funding new construction with your tax-deferred proceeds. This adaptability is a key reason the 1031 exchange remains a cornerstone of long-term real estate portfolio management.
The Reverse Exchange: Finding Your Target First
What happens when you find the ideal replacement property before you've even listed your current one? In a hot market, you can't afford to let a prime asset slip through your fingers. This is exactly where a Reverse Exchange comes into play, flipping the standard sequence on its head.
In a Reverse Exchange, an Exchange Accommodation Titleholder (EAT)—a special entity set up by your Qualified Intermediary—steps in to acquire and "park" the replacement property for you. This buys you time. You then have 180 days to sell your original property and officially complete the exchange.
It's an advanced strategy, no doubt, and comes with higher complexity and costs. But for situations where a must-have replacement property is on the line, the buying power and certainty it provides are invaluable.
The Improvement Exchange: Building Value with Tax-Deferred Funds
Sometimes, the best replacement property is one you build yourself. An Improvement Exchange, also known as a Construction or Build-to-Suit Exchange, lets you use your 1031 proceeds to not only buy a new property but also to fund significant improvements or even ground-up construction on it.
Similar to a reverse exchange, the EAT holds the title to the new property while the construction is underway. The crucial rule here is that the property's value after the improvements are finished must be equal to or greater than the property you sold. Get that right, and you achieve full tax deferral. It's a powerful tool for any value-add investor looking to create their ideal asset.
The Delaware Statutory Trust (DST): A Path for Passive Investors
For high-net-worth investors and family offices looking for a more passive, hands-off approach, the Delaware Statutory Trust (DST) is an elegant and powerful solution. A DST allows you to exchange your actively managed property for a fractional ownership interest in a large, institutional-quality, professionally managed real estate portfolio.
Investor Take: Think of a DST as trading the headaches of being a landlord for a passive stake in a portfolio of high-grade assets—like Class A apartment buildings or medical office centers—that would otherwise be out of reach for a single investor. The IRS gave DSTs its official blessing for 1031 exchanges in 2004, cementing their role as a go-to solution for simplifying a portfolio while keeping that tax-deferred growth going.
This structure is a lifesaver for investors running out of time on their 45-day identification clock or those who want to diversify their holdings across different asset classes and regions without taking on new management duties. You can learn more in our guide to passive 1031 real estate investing with DSTs.
At the end of the day, the 1031 exchange is a tool for strategic capital recycling, not permanent tax avoidance. A comprehensive study of over 1.6 million real estate deals found that 88% of replacement properties are eventually sold in a taxable event. The real benefit is the deferral that fuels portfolio growth over time. Choosing the right exchange structure ensures this powerful tool aligns perfectly with your immediate needs and long-term wealth goals.
Risk & Mitigation for 1031 Exchanges
While powerful, a 1031 exchange is not without risk. Success requires careful planning to navigate potential pitfalls.
RISK: Timeline Pressure. The strict 45/180-day deadlines can force rushed decisions in competitive markets, leading to overpaying or acquiring a suboptimal property.
MITIGATION: Begin searching for replacement properties before your relinquished property is under contract. Have multiple backup options identified and pre-vetted.
RISK: Financing Delays. Securing debt for the replacement property can be a major hurdle within the 180-day closing window. A delay with a lender can cause the entire exchange to fail.
MITIGATION: Engage with lenders and have financing pre-approved early in the process. Consider assets with assumable debt or have all-cash backup plans if feasible.
RISK: QI Security Failure. The security of your funds while held by the Qualified Intermediary is paramount. A less reputable QI could expose your capital to risk.
MITIGATION: Thoroughly vet your QI. Insist on a firm that holds funds in segregated, qualified escrow accounts and carries substantial fidelity bond and Errors & Omissions insurance.
Investor Checklist: Questions to Ask Before Starting a 1031 Exchange
Pulling off a successful 1031 exchange is about proactive diligence and having a well-vetted team in your corner. Before you even think about listing your property, running through this checklist can be the difference between a smooth transition of capital and a costly, taxable mistake.
Questions for Your Qualified Intermediary (QI):
How are my funds secured? Ask about fidelity bonds, E&O insurance, and segregated trust accounts.
How many exchanges of this size and complexity do you handle annually?
Who will be my dedicated point of contact throughout the entire process?
Questions for Your Tax and Legal Advisors: 4. What is my exact total tax liability (federal, state, depreciation recapture) if this exchange fails? 5. What are the precise equity and debt targets I must meet to achieve 100% tax deferral? 6. Are there any state-specific "clawback" provisions or filing requirements I need to be aware of?
Strategic Planning Questions for Yourself and Your Team: 7. Have we started scouting for replacement properties before listing the current asset? 8. What is our contingency plan if our top replacement property choice falls through during due diligence? 9. Do we have all parties (lenders, attorneys, inspectors) lined up to act quickly once the clock starts? 10. Is our documentation process streamlined? Consider real estate e-signature solutions to avoid delays.
The economic ripple effects of these transactions are huge. As previously noted, a 2021 Ernst & Young analysis shows just how vital they are to the national investment scene. Read the full research about the economic contributions of like-kind exchanges on lmu.edu.
Final Thoughts: A Prudent Path to Wealth Creation
A well-executed 1031 tax-deferred exchange is more than just a tax strategy; it's a disciplined approach to building and preserving wealth through real estate. By allowing you to continuously redeploy your entire equity into new opportunities, it serves as a powerful engine for compounding growth. While the rules are strict and the risks of failure are real, the mitigants are clear: meticulous planning, a strong advisory team, and a proactive approach to sourcing your next investment. When structured correctly, the 1031 exchange remains a prudent, resilient component of a long-term real assets strategy.
Let Us Help You Find Your Next Investment
Ready to see how a 1031 exchange can power your long-term wealth strategy? The team at Stiltsville Capital can help you navigate the entire process and source high-quality replacement properties, including passive DST options. Schedule a confidential call with us today.
Information presented is for educational purposes only and does not constitute an offer to sell or a solicitation of an offer to buy securities. Any offering is made only through definitive offering documents (e.g., private placement memorandum, subscription agreement) and is available solely to investors who meet applicable suitability standards, including “Accredited Investor” status under Rule 501 of Regulation D. Investments in private real estate involve risk, including loss of capital, illiquidity, and no guarantee of distributions. Past performance is not indicative of future results. Verification of accredited status is required for participation in Rule 506(c) offerings.