Net Operating Income & Cap Rate: A Guide for Real Estate Investors
- Ryan McDowell

- Oct 28, 2025
- 11 min read
Reading Time: 8 min | Good for: Novice (A), Informed (B), Sophisticated (C)
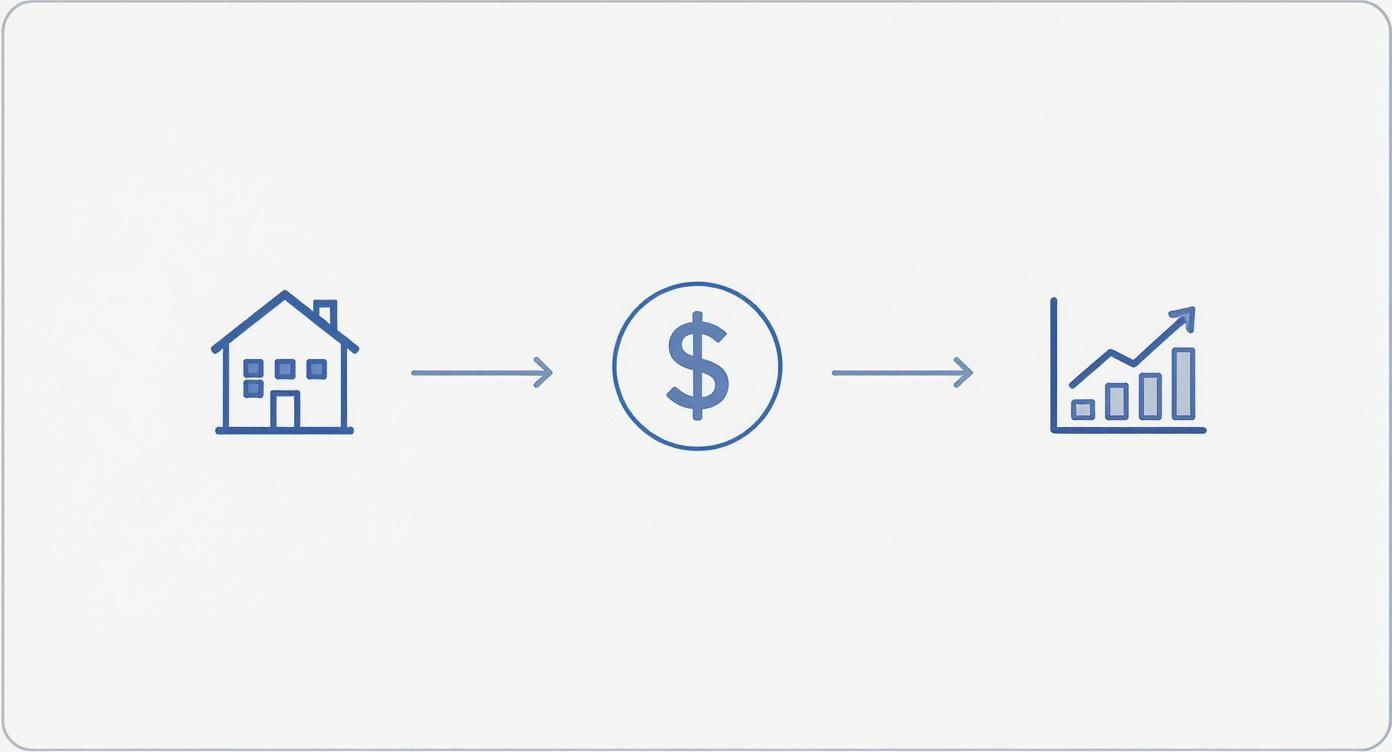
In commercial real estate investing, two metrics form the bedrock of every sound decision: Net Operating Income (NOI) and the capitalization rate, or cap rate. Think of them as the vital signs of an investment property. They cut through market noise to reveal a property's true earning power and its value relative to other opportunities.
Simply put, NOI is a property's pure annual profit before factoring in debt service or capital improvements. The cap rate expresses that profit as an unlevered rate of return, providing a standardized yardstick for comparison.
TL;DR: Key Takeaways
NOI is Pure Profit: It measures a property's operational profitability, calculated as all revenue minus necessary operating expenses.
Cap Rate is Relative Value: The cap rate (NOI / Property Value) shows your potential unlevered return and allows for apples-to-apples comparisons across different assets and markets.
Inverse Relationship: Property values and cap rates move in opposite directions. When values rise, cap rates compress (fall), and vice versa.
Forced Appreciation: The most powerful value-add strategies focus on increasing a property's NOI, which directly increases its market value at a given exit cap rate.
Market Why-Now: The Rate Environment Matters
The relationship between interest rates and real estate values is more critical than ever. After a period of historically low rates, the U.S. 10-Year Treasury yield—a key benchmark for real estate risk premiums—has seen significant volatility, hovering above 4.0% for much of 2023-2024. As of Q2 2024, data from CBRE shows that this higher cost of capital has pushed cap rates upward across most property types. This market shift underscores the importance of disciplined underwriting and focusing on assets with strong NOI growth potential to offset valuation headwinds.
This guide is designed for investors at every level—from those just building a portfolio to sophisticated family offices that need to benchmark risk with institutional precision. We'll walk through exactly how these metrics work, from the basic math to strategic market analysis.
How to Calculate Net Operating Income (NOI) Step by Step
Before you can underwrite a commercial real estate deal, you must arrive at its financial core: the Net Operating Income (NOI). This calculation is foundational because it strips away financing and capital expenditures to reveal a property’s raw, unlevered profitability.
Think of NOI as the horsepower of a property's economic engine. Before discussing speed or efficiency (where the cap rate comes in), you must first know how powerful that engine is.
This chart lays out the journey from a property's gross potential to its net operating income, a clear picture of its profit and potential.
As you can see, nailing down a property's income and expenses is the essential groundwork for figuring out what kind of return you can expect.
Step 1: Start With Gross Potential Income (GPI)
First, establish the Gross Potential Income (GPI). This is the absolute maximum income a property could generate if every unit were occupied for the entire year, with every tenant paying full market rent without a single delay. It's the "perfect world" number.
For a 50-unit apartment building where each unit commands $2,000 per month:
50 units x $2,000/month x 12 months = $1,200,000
Step 2: Adjust For Vacancy And Credit Loss
Now, let's return to reality. No property is 100% occupied all the time, and unfortunately, not every tenant pays on time. To find the Effective Gross Income (EGI), you must subtract an allowance for these vacancies and credit losses. This rate is usually based on the property’s history and local market data.
Using a conservative 7% vacancy and credit loss rate:
Vacancy Loss: $1,200,000 (GPI) x 7% = $84,000
EGI: $1,200,000 - $84,000 = $1,116,000
This EGI figure is what you can realistically expect to collect.
Step 3: Subtract Operating Expenses (OpEx)
From your realistic income, it's time to subtract the Operating Expenses (OpEx). These are all the day-to-day costs that keep the lights on and the property running smoothly. Getting this right means tracking everything meticulously, which is where good property management apps become invaluable.
Common operating expenses include:
Property Taxes: The non-negotiable bill from the local municipality.
Property Insurance: Essential coverage for liability, fire, and other potential disasters.
Utilities: Costs for common areas not directly billed to tenants.
Repairs & Maintenance: Ongoing costs for plumbing, landscaping, HVAC, and general upkeep.
Property Management Fees: Typically a percentage of EGI, often between 4-8% for multifamily properties.
### Novice Lens: What NOT to Include in OpExIt’s absolutely critical to exclude these items from your OpEx calculation. Forgetting this is a common mistake.* Debt Service: Your mortgage payments (principal and interest).* Capital Expenditures (CapEx): Major, infrequent costs like a new roof or HVAC system.* Depreciation: An accounting concept, not a cash expense.NOI measures the property's performance independent of your financing or long-term capital strategy.
For our example building, let's say the total annual OpEx adds up to $450,000.
Illustrative NOI Calculation for a Multifamily Property
Here’s a simple table that walks through the entire calculation, from top-line potential to the bottom-line NOI.
Line Item | Calculation/Notes | Amount |
|---|---|---|
Gross Potential Income (GPI) | 50 units @ $2,000/mo for 12 months | $1,200,000 |
Less: Vacancy & Credit Loss | 7% of GPI | ($84,000) |
Effective Gross Income (EGI) | GPI - Vacancy & Credit Loss | $1,116,000 |
Less: Operating Expenses (OpEx) | Sum of all day-to-day costs | ($450,000) |
Net Operating Income (NOI) | EGI - Total OpEx | $666,000 |
This final number—the Net Operating Income—is the pure, unlevered profit generated by the property itself.
Step 4: The Final NOI Calculation
With all the pieces in place, the final step is simple subtraction:
NOI = EGI - Total Operating Expenses
NOI = $1,116,000 - $450,000 = $666,000
This $666,000 figure is the key. It's the number that tells you exactly how much cash the asset produces before any debt is paid, and it's the number you’ll use to calculate the net operating income cap rate.
Understanding the Capitalization Rate Formula
Once you’ve nailed down the Net Operating Income, you have the raw financial horsepower of the asset. The next step is translating that power into a measure of investment yield and market value. That’s where the capitalization rate, or cap rate, comes in.
It's one of the most-cited metrics in commercial real estate for a good reason.
At its heart, the formula is refreshingly simple, creating a direct link between a property's income, its value, and its potential return.
The Core Formula
You calculate the cap rate by dividing a property's Net Operating Income by its current market value or purchase price.
Cap Rate = Net Operating Income (NOI) / Property Value
Think of the cap rate as the unlevered annual return on your investment. In other words, if you bought a property with all cash, the cap rate would be your cash-on-cash return for the first year, before factoring in taxes or appreciation. It gives investors a standardized way to compare the relative value of different opportunities.
For example, a property with an NOI of $100,000 valued at $2,000,000 has a cap rate of 5.0% ($100,000 ÷ $2,000,000).
The Inverse Relationship Between Value and Cap Rates
This is a critical concept. There's an inverse relationship between property values and cap rates. When one goes up, the other goes down.
Higher Property Values lead to Lower Cap Rates (cap rate "compression"). This typically happens when demand is high and investors are willing to pay more for the same income stream, accepting a lower initial yield to get into a hot market.
Lower Property Values lead to Higher Cap Rates (cap rate "expansion"). This occurs when perceived risk increases or demand cools, forcing sellers to lower prices to attract buyers seeking higher returns.
### Insight Edge: What's a "Good" Cap Rate?A "good" cap rate is entirely dependent on your investment strategy. A growth-focused investor might eagerly accept a low 4.5% cap rate for a Class A apartment building in a booming Sunbelt city, betting on future rent growth and appreciation. In contrast, an income-focused investor may target a higher 6.5% cap rate on a stabilized asset in a secondary market for more immediate cash flow, accepting lower growth potential. Your goals define the metric's value.
How Market Dynamics Influence Cap Rates
A cap rate isn't just a static formula; it’s a living reflection of the broader economy and investor sentiment. Understanding the forces that push cap rates up or down is crucial for accurate underwriting, smart forecasting, and knowing when to enter—or exit—an investment.
Interest Rates and the 10-Year Treasury
The biggest outside influence on cap rates is the cost of capital. The key benchmark is the 10-year Treasury yield, often considered the "risk-free" rate of return. Commercial real estate is inherently risky—it's illiquid and requires active management—so it must offer a return significantly higher than the 10-year Treasury. This gap is known as the risk premium or "spread."
When interest rates rise, borrowing becomes more expensive. To hit their target returns, investors need higher yields from properties, which puts direct upward pressure on cap rates. While cap rates and the 10-year Treasury historically move in tandem, they don't always sync perfectly. A full analysis of these cycles shows how these relationships play out over time.
The Impact of Location and Property Type
Just like in residential real estate, location is everything. A new, Class A apartment building in a booming primary market will trade at a much lower cap rate than an older, Class B office building in a city with declining job growth. This difference comes down to perceived risk and future growth potential.
Primary Markets (e.g., Miami, Austin): These hotspots command lower cap rates (compression) because of strong population growth, high liquidity, and potential for rent increases. Investors will pay a premium for that stability and upside.
Secondary/Tertiary Markets: You'll find higher cap rates here. Investors need to be compensated for taking on more perceived risk, dealing with fewer potential buyers, and facing more uncertain growth prospects.
Asset Class: The property type matters. A stabilized multifamily complex with diversified tenant risk is considered safer than a retail building relying on a single tenant. The riskier asset will demand a higher cap rate.
Investor Takeaway: Looking at today's cap rate is only half the battle. You must forecast where it's headed. If you buy a property at a 5% cap rate but expect rising interest rates to push market cap rates to 6% by your planned exit, your property's NOI must grow enough to overcome that headwind and protect your investment's value. This is a core principle of our disciplined approach at stiltsvillecapital.com.
Putting NOI and Cap Rate to Work in Your Analysis
Now that you have a solid grip on NOI and cap rates, it’s time to move from theory to action. These two metrics are the workhorses of underwriting, letting you quickly size up deals, compare opportunities, and pinpoint where true value lies.
Using Market Cap Rates to Estimate Property Value
One of the most powerful uses of the net operating income cap rate is for a quick, "back-of-the-envelope" valuation. If you know the going cap rate for a certain property type in a specific market, you can estimate its value in minutes. The formula is a simple rearrangement:
Property Value = Net Operating Income (NOI) / Market Cap Rate
Let's say a multifamily building generates an NOI of $500,000. You know from market data that similar properties recently sold at a 5.0% cap rate. Your initial valuation would be $10 million ($500,000 / 0.05).
This calculation is a critical first step in our due diligence, helping us filter out overpriced deals before committing significant resources. Our team uses this daily to see if an opportunity aligns with our strict acquisitions criteria.
The Deal Lens Example: Creating Equity with a Value-Add Strategy
Here’s where savvy investors build wealth. A value-add strategy is about actively increasing a property's NOI, which directly pushes up its value for a profitable exit.
The Acquisition: You buy an underperforming apartment building for $10 million. Its current NOI is $500,000, meaning you acquired it at a 5.0% "going-in" cap rate.
The Value-Add Plan: You invest $1 million in capital improvements—modern kitchens, updated bathrooms, and refreshed common areas—to justify higher rents.
The Resulting NOI: After the renovation, the property’s NOI jumps to $650,000, thanks to increased rental income and more efficient operations.
The Exit: The property is now stabilized and renovated. The market for these premium assets is stronger, and they're trading at a lower 4.75% "exit" cap rate. Your property is now valued at approximately $13.68 million ($650,000 / 0.0475).
### Key Takeaway: Forced AppreciationBy increasing the NOI from $500,000 to $650,000, you didn't just add $150,000 in annual income—you "forced" the property's value to appreciate by over $3.6 million. This is the heart of a successful value-add real estate strategy. Utilizing sophisticated tools like Real Estate Business Intelligence can provide a major edge in identifying these opportunities.
Your Investor Checklist: 7 Questions to Ask a Sponsor
When evaluating a deal, use these questions to dig beyond the surface-level numbers:
NOI Verification: Is the presented NOI based on trailing 12-month actuals (T12) or a forward-looking pro forma? Can you provide detailed, itemized financials?
CapEx Reserves: What are the planned capital expenditures over the next five years, and how are they being funded? Are these costs realistically budgeted?
Vacancy Assumptions: How does your vacancy assumption compare to the submarket's historical average for this asset class?
Rent Growth Projections: What specific market data supports your rent growth assumptions? Are they in line with forecasts from third-party sources like CoStar or CBRE?
Operating Expense Comparables: How do the property's operating expenses per unit compare to similar assets in the area? Are there clear opportunities for efficiency gains?
Exit Cap Rate Sensitivity: How does the projected return change if the exit cap rate is 50 or 100 basis points higher than your base case?
Management Track Record: What is your track record of achieving projected NOI growth on similar properties in this market?
FAQ: Digging Deeper on NOI & Cap Rates
Once you get the hang of NOI and cap rates, a few common questions always pop up. Let's tackle them head-on.
What’s a “Good” Cap Rate in today's market?
This is the million-dollar question, and the answer remains: it depends entirely on your goals, the property type, and the market. A low cap rate (e.g., 4.5%) in a high-growth market like Austin might be a home run for a growth-focused investor. In contrast, an income-focused investor might target a 6.5% cap rate in a stable secondary market for steady cash flow. A "good" cap rate is one that fits your risk appetite and adequately compensates you for the asset's location and quality.
Does a Bigger NOI Automatically Mean a Better Deal?
Not by itself. A massive NOI is great, but the real question is, what did you have to pay to get it? That’s what the cap rate tells you. A property generating a $1 million NOI is fantastic, but if it costs $25 million (a 4% cap rate), it may be less attractive than an asset with a $750,000 NOI acquired for $10 million (a 7.5% cap rate). The relationship between income and cost defines your return.
How Do Interest Rates Play into All This?
When the Fed raises rates, borrowing becomes more expensive. To compensate, real estate investors demand higher returns (cap rates), which can push property values down. We saw this in the multifamily sector: after hitting historic lows around 4.5% from 2020-2022, aggressive rate hikes pushed average multifamily cap rates up significantly. By 2024, they were hovering around 5.75%—the highest in a decade, according to industry sources. For more on this, see analysis on multifamily cap rate trends.
Investor Takeaway: Pro Forma vs. Trailing NOIWhen looking at a deal, you'll see two types of NOI. The Trailing NOI is based on what the property actually did over the last 12 months. The Pro Forma NOI is a seller's projection of what it could do. A smart investor always starts with the proven, trailing numbers and treats the pro forma with healthy skepticism.
Can a Cap Rate Be Negative?
Theoretically, yes, but it's incredibly rare and a massive red flag. A negative cap rate means operating expenses exceed income—you'd be losing money before paying the mortgage. This only occurs with severely distressed assets. For almost every investor, a negative cap rate is a clear signal to walk away.
At Stiltsville Capital, our disciplined underwriting process is built on a deep, nuanced understanding of these metrics. We analyze every deal through the lens of market dynamics, risk, and value-add potential, believing that well-structured real estate can be a prudent, resilient component of a long-term wealth strategy.
Information presented is for educational purposes only and does not constitute an offer to sell or a solicitation of an offer to buy securities. Any offering is made only through definitive offering documents (e.g., private placement memorandum, subscription agreement) and is available solely to investors who meet applicable suitability standards, including “Accredited Investor” status under Rule 501 of Regulation D. Investments in private real estate involve risk, including loss of capital, illiquidity, and no guarantee of distributions. Past performance is not indicative of future results.
Comments