Cap Rate and NOI: Your Guide to Smarter Real Estate Investing
- Ryan McDowell

- Oct 4
- 11 min read
Reading Time: 7 min | Good for: Novice Investors (A), Family Offices (B)
TL;DR: Your Executive Summary
Net Operating Income (NOI) is a property's pure profit before mortgage and income taxes. It's the truest measure of a property's operational performance.
Capitalization Rate (Cap Rate) is the expected annual return on an all-cash purchase. It's a quick way to compare market value and risk across similar properties.
The Power Duo: NOI is the engine (how much cash it makes); the cap rate is the speedometer (how fast it's returning value for its price). Mastering their relationship is non-negotiable for serious due diligence.
Investor Action: Use these metrics to challenge a sponsor's assumptions. True value is created by either increasing the NOI (operational skill) or capitalizing on shifting cap rates (market timing)—or ideally, both.
Your Compass for Real Estate Value

For sophisticated investors—from family offices to institutional players—every decision must be backed by solid data. In the world of commercial real estate, Net Operating Income (NOI) and the Capitalization Rate (Cap Rate) are the bedrock of that data. They strip away the fluff to reveal an asset's core financial health and how it stacks up against the market.
An easy way to think about it is to picture the property as a car. The NOI is its engine—the raw measure of its income-producing power. The cap rate is the speedometer—it tells you how fast that engine is performing relative to the price you paid.
Why NOI and Cap Rate Matter
These two metrics are a package deal. Looking at one without the other only gives you half the picture.
NOI tells you how well the property is run. A building with a healthy, growing NOI is a sign of a well-oiled machine. It means the sponsor is doing a good job maximizing rent and keeping expenses in check.
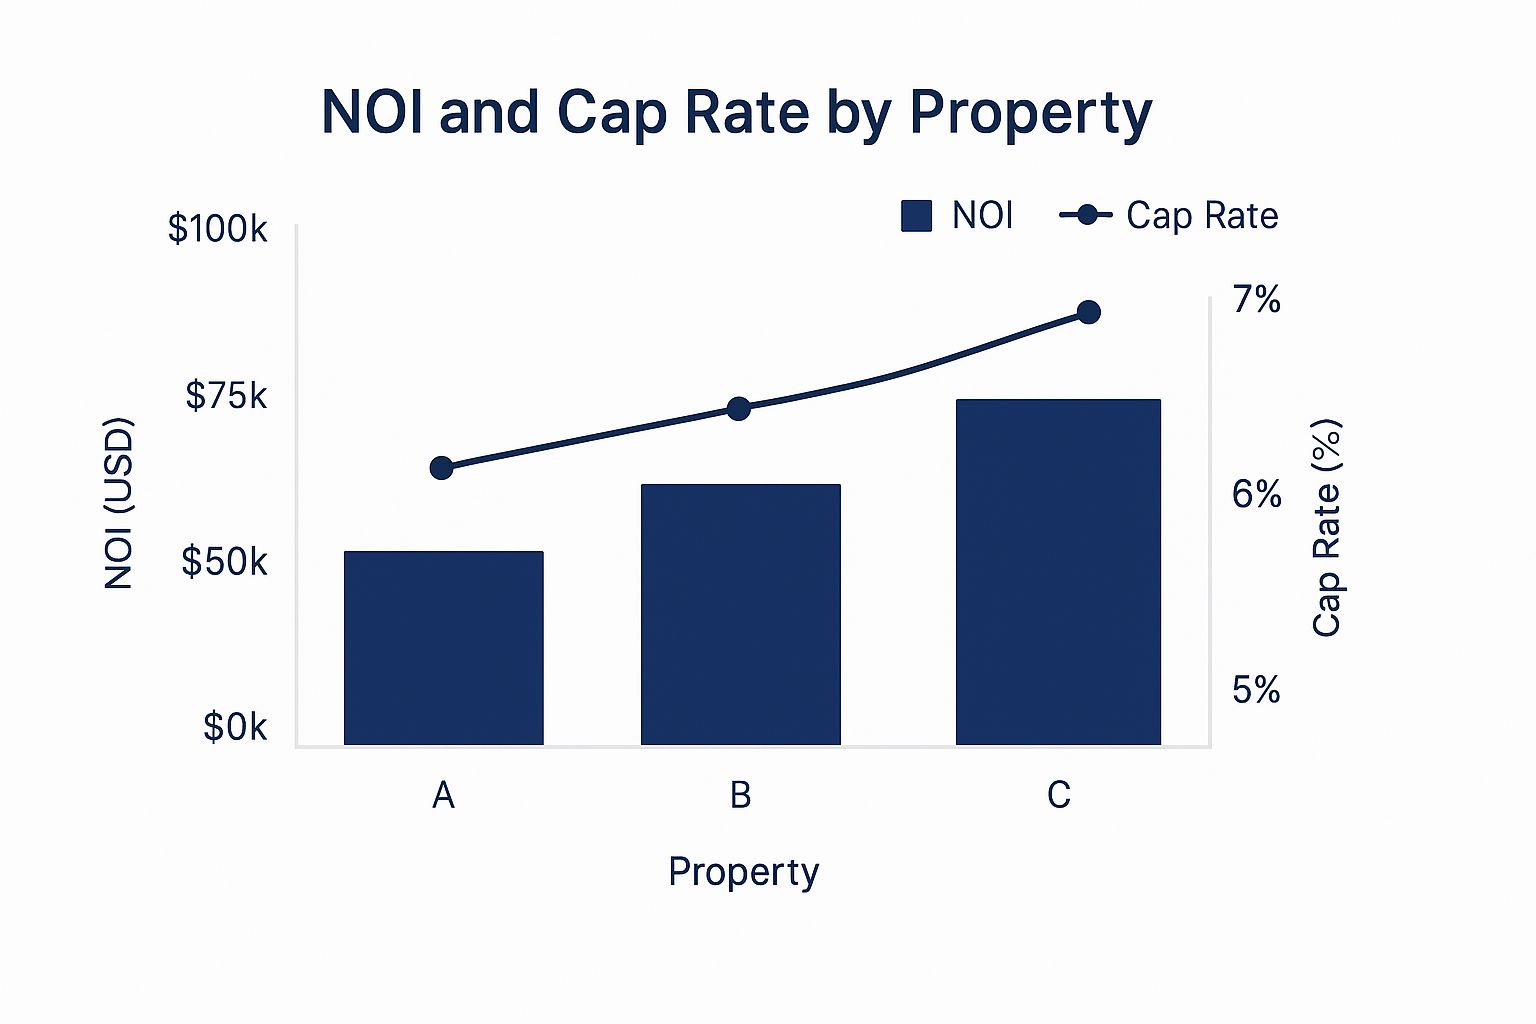
Cap rate is a snapshot of the market's mood. It's a quick way to gauge the risk and return investors expect for a certain type of property in a specific area. A low cap rate means demand is high and the asset is seen as a safe bet. A high cap rate might signal more risk, but it could also mean a bigger opportunity.
To give you a quick cheat sheet, here’s a breakdown of these essential metrics.
Key Metrics at a Glance
Metric | Definition | Simple Formula | Primary Use |
|---|---|---|---|
NOI | The property's annual income after operating expenses, but before debt service and income taxes. | Gross Income - Operating Expenses | To measure a property's profitability and operational efficiency. |
Cap Rate | The expected rate of return on an all-cash purchase, expressed as a percentage. | NOI / Property Value | To quickly compare the value and potential return of similar properties. |
Insight Edge: The Investor TakeawayGetting this right is non-negotiable. Mastering the relationship between NOI and cap rate lets you instantly compare different deals, challenge a sponsor's assumptions, and pinpoint where the real value is—whether that's through operational fixes (boosting NOI) or smart timing (taking advantage of shifting cap rates).
By learning to dissect these core numbers, you can move past surface-level pitches and start making investment decisions with real confidence. This guide will walk you through exactly how to calculate and use these metrics in your own due diligence.
Calculating Net Operating Income: Your Property’s True Profit
When you're evaluating an investment property, you need a way to cut through the noise and see its actual profitability. That's where Net Operating Income (NOI) comes in. Think of it as the annual profit the property generates on its own, completely separate from your personal financing or tax situation.
Getting this number right is the bedrock of any solid real estate deal. The math itself isn't complicated, but the details are what separate a back-of-the-napkin guess from a professional-grade analysis.
The NOI Formula Unpacked
At its heart, the formula is simple: Effective Gross Income (EGI) - Operating Expenses = Net Operating Income (NOI). Let's pull back the curtain on each piece of that equation.
Start with Gross Potential Income (GPI) This is your "best-case scenario" number. It’s what you'd collect if every single unit was rented at full market rate for the entire year, plus any extra cash from things like parking spots, laundry machines, or vending services.
Calculate Effective Gross Income (EGI) Let's get real—no property stays 100% full all the time. EGI adjusts for this reality by subtracting losses from vacancies and tenants who don't pay. Depending on the market and the building's quality, a vacancy factor of 5-10% is a pretty standard assumption.
Subtract Operating Expenses (OpEx) This is where your due diligence really pays off. Operating expenses are all the costs required to keep the lights on and the property running smoothly day-to-day. A complete list is crucial, and it helps to understand all potential rental property tax deductions as well. Here are the usual suspects: * Property Taxes: An unavoidable and often significant line item. * Insurance: Covers you against liability and physical damage to the asset. * Utilities: Any costs you're not passing on to tenants, like electricity for common areas. * Property Management Fees: Usually a percentage of your EGI. * Repairs & Maintenance: For routine upkeep—think landscaping, not a new roof.
Novice Lens: Why It MattersA clean NOI calculation lets you compare the performance of two completely different properties on an apples-to-apples basis. It shows you how well a property is being managed, without the owner's mortgage muddying the waters.
What to Exclude from NOI Calculations
Knowing what not to include is just as important. These are costs tied to the owner, not the property itself.
Debt Service: Your mortgage payments (principal and interest) are about financing, not operations.
Capital Expenditures (CapEx): Big-ticket, one-off upgrades like replacing an HVAC system or paving the parking lot are handled separately.
Income Taxes: This depends entirely on the owner's unique tax situation.
Depreciation: This is a non-cash "paper" expense used for tax purposes.
Sticking to these rules ensures your cap rate and NOI analysis is built on a solid foundation. For a more detailed look, check out our guide for real estate investors on how to find net operating income.
How to Interpret the Capitalization Rate

The cap rate is so much more than a simple percentage. Think of it as a powerful barometer for market sentiment, risk, and opportunity. While the formula itself is straightforward, its real magic is in what it tells you about the market's collective opinion of a property. It's your quick gauge for risk-adjusted returns.
At its core, the cap rate shows the inverse relationship between a property’s price and its potential return. To really get a feel for this, understanding how to calculate financial ratios in a broader sense is helpful, as the cap rate is a classic example. A lower cap rate means investors are willing to pay a premium for every dollar of Net Operating Income (NOI).
This usually happens in stable, high-demand markets where properties are seen as low-risk, "safe-haven" investments. On the flip side, a higher cap rate suggests investors are demanding a bigger return to stomach what they see as higher risk—maybe a less-than-perfect location or an older building that needs a lot of work.
Low Cap Rate vs. High Cap Rate
Let's be clear: neither a high nor a low cap rate is inherently "good" or "bad." They just represent different points on the risk-reward spectrum.
Low Cap Rates (e.g., 3-5%): These often signal stability, strong tenant demand, and high property values. You'll typically see these in prime assets in gateway cities like New York or Los Angeles.
High Cap Rates (e.g., 8-10%+): This usually points to higher risk but also a shot at a greater return. It could be a value-add opportunity in a secondary market or a more volatile asset class.
Persona B – Why it matters: For family offices and wealth advisors, the cap rate is your first-glance indicator of where an asset fits in a portfolio. A low cap rate asset may suit a capital preservation strategy, while a higher cap rate might align with a more opportunistic, growth-focused mandate.
Grasping this dynamic is crucial. For example, the U.S. apartment sector saw cap rates tighten to a historic low of 4.1% back in 2021, fueled by rock-bottom interest rates and intense demand. But as the economy shifted, they climbed to around 5.2% by early 2024, showing a market-wide recalibration of risk and value.
This is exactly why you need to use the cap rate as a comparative tool. By lining up the cap rates of similar properties in the same submarket, you can quickly get a sense of whether an asset is priced fairly. For a deeper dive into the mechanics, you can also explore our clear guide on the capitalization rate formula in real estate. This kind of apples-to-apples analysis is a fundamental step in any sophisticated underwriting process.
Putting NOI And Cap Rate To Work: A Practical Example
Now that we've broken down NOI and cap rate, it's time to see them in action. This is where theory hits the pavement, giving us a powerful tool to underwrite deals and create real value.
Let's walk through a tangible example, highlighting the interplay between a property's performance (NOI) and what the market is willing to pay for it (cap rate).
Imagine we're looking at a 100-unit apartment building. After running the numbers, we've determined its annual Net Operating Income is a clean $1,000,000. By looking at recent sales of similar buildings in the neighborhood, we see that the going market cap rate is about 5.0%.
With these two figures, we can pin down the property's value using that core formula we discussed: Value = NOI / Cap Rate.
Property Value = $1,000,000 / 0.05 = $20,000,000
This $20 million valuation is our starting point. But a smart investor never stops there. The real magic happens when you realize you can influence these numbers.
Deal Lens: Driving Value By Increasing NOI
One of the most common strategies in value-add real estate is to find ways to boost a property's NOI. This usually involves a mix of increasing revenue and trimming expenses.
Let's say the new owner invests in a renovation plan. They upgrade the kitchens and bathrooms in each unit, which allows them to raise the average monthly rent by $150.
Additional Annual Revenue: 100 units x $150/month x 12 months = $180,000
If we assume the operating costs stay the same, the property's new NOI jumps to $1,180,000. And if that 5.0% market cap rate holds steady? The property’s value gets a serious lift.
New Property Value = $1,180,000 / 0.05 = $23,600,000
That's the power of operational improvements. For every single dollar of new NOI we created, the property's value shot up by $20 (which is 1 / 0.05). This "multiplier effect" is the secret sauce behind most successful value-add deals.
Scenario 2: The Impact Of Shifting Market Cap Rates
Now, let's look at something outside of our direct control: the market itself. What if changing interest rates or a flood of new investors into the area causes the market cap rate for similar properties to compress (decrease) to 4.5%?
Even if we did nothing to improve the property and the NOI stayed at the original $1,000,000, the market dynamics alone would increase its value.
New Property Value = $1,000,000 / 0.045 = $22,222,222
This is a clear example of how external market forces can create value, even without any physical changes to the asset.

Illustrative Scenario Analysis: NOI & Cap Rate Impact On Value
To really drive this home, the table below shows how tweaking either the NOI or the cap rate from our baseline example directly impacts the final valuation.
Scenario | Annual NOI | Market Cap Rate | Calculated Property Value |
|---|---|---|---|
Baseline | $1,000,000 | 5.0% | $20,000,000 |
NOI Increase | $1,180,000 | 5.0% | $23,600,000 |
Cap Rate Compression | $1,000,000 | 4.5% | $22,222,222 |
Combined Effect | $1,180,000 | 4.5% | $26,222,222 |
As you can see, the most powerful outcome occurs when you combine operational improvements (higher NOI) with favorable market conditions (lower cap rate). This is the grand slam for a real estate investor.
These examples boil down to the two main levers you can pull to create value: operational excellence (which you control) and market timing (which you navigate).
While cap rates give us an invaluable snapshot of a property's value today, a more sophisticated analysis projects performance into the future. For that, we turn to other tools. To learn more, check out our guide on how to calculate a discounted cash flow for real estate success.
Advanced Strategies for Savvy Investors
Once you’ve nailed the basics of how cap rate and NOI work together, you can start looking at deals with a more strategic, forward-looking eye. Experienced investors get it: a "good" cap rate isn't some magic number. It's all about context and strategy.
Market Signal Box (Q2 2024)
Data Point: Major real estate markets are seeing cap rates slowly expand. Projections from sources like Morgan Stanley point to a potential 30 to 50 basis point increase across key sectors by 2028.
Interpretation: Rising cap rates put downward pressure on property values, all else being equal. However, strong fundamentals are providing a powerful counterbalance.
Investor Take: With expected NOI growth averaging around 270 basis points, this income boost should more than cover the impact of rising cap rates, keeping values stable for high-quality assets. The clear signal is that future returns will be driven by real income growth, not just by cap rate compression. You can dig into a deeper analysis of these global real estate trends from Morgan Stanley.
Investor Checklist: Questions to Ask a Sponsor
With this deeper understanding of cap rate and NOI, you’re ready to ask the sharp, insightful questions that get to the heart of an investment. Use this checklist in your next conversation.
[ ] What are your specific assumptions for NOI growth year-over-year, and what specific operational changes will drive that?
[ ] How does your projected exit cap rate compare to what similar assets are trading for in the market today?
[ ] What are the biggest risks that could prevent you from hitting your projected NOI or exit valuation?
[ ] Can you walk me through the "comps" you used to arrive at your purchase price and exit cap assumptions?
[ ] What is the pro-forma cap rate, and how large is the gap between that and the in-place cap rate? A large gap could mean high risk or high reward.
Still Have Questions About Cap Rate and NOI?
Even after you’ve got the formulas down, it's natural to have a few lingering questions about how cap rate and NOI actually work out in the real world. Let's tackle some of the most common questions we hear from investors.
Is a Higher Cap Rate Always Better?
Not always. Think of a high cap rate as a double-edged sword. On one hand, it could signal a fantastic value-add opportunity with serious upside. But on the other hand, it often serves as a warning sign for higher risk—a property in a declining neighborhood, one needing significant capital improvements, or an asset losing tenants. The key is to dig in and find out why the cap rate is high before you assume you've found a bargain.
Can a Property Have a Negative NOI?
Yes, it’s absolutely possible for a property to have a negative Net Operating Income, and it's a massive red flag. This happens when a property's total operating expenses are higher than all the income it brings in. This can be caused by high vacancy, sloppy management, or major unexpected repairs. A property that consistently runs a negative NOI isn't just underperforming; it's actively losing money before you even think about the mortgage payment.
How Do Interest Rates Affect Cap Rates?
Interest rates and cap rates typically have a strong inverse relationship. When the cost to borrow money (interest rates) rises, investors need higher returns to make a deal worthwhile, which pushes cap rates up. Conversely, when interest rates fall, borrowing gets cheaper, which tends to increase buyer demand, push property prices higher, and squeeze cap rates lower. Keeping an eye on this dynamic is critical for timing your buys and sells.
What Is a “Pro-Forma” Cap Rate?
A "pro-forma" cap rate is a projected cap rate based on what an investor thinks a property will do in the future, not what it's done in the past. Sponsors use them to show the potential return after they've executed their business plan (e.g., renovated units and raised rents). While essential for analyzing a value-add deal, you must treat these projections with healthy skepticism. Always challenge the assumptions behind them.
Ready to move beyond the basics and see how disciplined underwriting can unlock real value in today's market? The team at Stiltsville Capital can help you find opportunities that fit your long-term strategy for building wealth.
Schedule a confidential call with us to discuss your investment goals.
Learn more about our approach at https://www.stiltsvillecapital.com.
Information presented is for educational purposes only and does not constitute an offer to sell or a solicitation of an offer to buy securities. Any offering is made only through definitive offering documents (e.g., private placement memorandum, subscription agreement) and is available solely to investors who meet applicable suitability standards, including “Accredited Investor” status under Rule 501 of Regulation D. Investments in private real estate involve risk, including loss of capital, illiquidity, and no guarantee of distributions. Past performance is not indicative of future results. Verification of accredited status is required for participation in Rule 506(c) offerings.


Comments