A Guide to the Capitalization Rate Real Estate Formula
- Ryan McDowell

- Nov 27, 2025
- 15 min read
Reading Time: 8 min | Good for: Novice Investors (A), Family Office Principals (B), Investment Committees (C)
TL;DR: The Bottom Line Up Front
The capitalization rate real estate formula (Cap Rate = Net Operating Income / Property Value) is a foundational metric for quickly assessing a property's potential return.
It measures the unlevered annual return based on current income, providing a universal benchmark to compare different investment opportunities. A low cap rate typically signals higher value and lower risk; a high cap rate suggests lower value and higher risk or a value-add opportunity.
Sophisticated investors don't just "buy" a cap rate; they force appreciation by strategically increasing a property's Net Operating Income (NOI), creating value independent of market shifts.
To truly diligence a deal, you must scrutinize the assumptions behind the cap rate, especially the difference between historical (trailing) and projected (pro-forma) income, and the sponsor's exit cap rate forecast.
This guide will walk you through calculating the formula, interpreting the results in today's market, and using this tool to build a winning investment strategy.
When you're sizing up a commercial real estate deal, one of the first numbers you'll hear tossed around is the capitalization rate, or "cap rate." It's a foundational metric, and for good reason. It cuts through the noise to give you a quick, clean look at a property's potential return.
The formula itself is straightforward: Cap Rate = Net Operating Income (NOI) / Property Value.
Think of it as the real estate version of a stock’s dividend yield. It gives you an immediate sense of the annual return an asset might generate based purely on its income, stripping away the complexities of financing and debt.
Decoding the Cap Rate: A Foundational Metric
This simple ratio connects two of the most critical variables in any real estate investment:
A property's income-generating potential (its Net Operating Income).
Its current market value (what a buyer is willing to pay for it today).
For newcomers, getting a handle on this relationship is the first step toward evaluating deals like a pro. For seasoned family offices and institutional investors, the cap rate is the starting point for a much deeper dive into risk, market trends, and hidden opportunities.
Why This Simple Formula Matters So Much
The cap rate is the universal language of brokers, sponsors, and investors.
When someone pitches a "5 cap" property in a prime downtown location versus an "8 cap" property in an up-and-coming neighborhood, they’re telling you a lot about perceived risk, stability, and growth. A lower cap rate usually signals a higher property value and lower risk, while a higher cap rate often means a lower property value and higher risk—or a major opportunity for the right operator to step in and create value.
Why It Matters (For Novice Investors): The cap rate is more than just a formula; it's a vital market indicator. It reflects investor sentiment and the flow of capital, providing a real-time pulse on how different asset classes and geographic locations are being priced.
But mastering the cap rate isn’t just about the calculation. To get the full picture, it's also helpful to understand what is rental yield, another key metric that helps round out your analysis of an asset's performance.
Throughout this guide, we'll break down every piece of the formula. We’ll show you not just how to run the numbers, but how to interpret them strategically to make sharp, informed investment decisions.
Calculating Net Operating Income: The Engine of the Cap Rate
If the cap rate is the speedometer for a real estate investment, then Net Operating Income (NOI) is the engine. Think of NOI as a property’s raw, unlevered profitability—what it earns from day-to-day operations before you even think about mortgages, income taxes, or big-ticket capital improvements.
Getting this number right is everything. A slight miscalculation, whether accidental or intentional, can throw the entire cap rate off, making a deal look much better (or worse) than it really is. This is where sharp, diligent investors separate themselves from the crowd.
The formula itself looks simple enough:
Net Operating Income (NOI) = Gross Operating Income - Total Operating Expenses
But the real work is in understanding what, exactly, goes into each side of that equation.
Starting with Gross Operating Income
First, you have to figure out the property’s total potential income. This is way more than just adding up rent checks; it’s about capturing every dollar the asset can generate.
Gross Potential Rent (GPR): This is the dream scenario—what the property would earn if it were 100% occupied all year, with every single tenant paying full market rent.
Vacancy & Credit Loss: Reality check. No property stays full forever. You absolutely must subtract a realistic percentage for empty units and tenants who don't pay. This is a make-or-break assumption in any underwriting.
Other Income: Don't forget the extras. This covers all the other ways a property makes money, like fees for parking, laundry machines, storage units, or even pet rent in a multifamily building.
Add all that up, and you get the Effective Gross Income (EGI), which is the true top-line revenue you can realistically bank on.
Subtracting True Operating Expenses
Next, you deduct all the costs required to keep the property running. These are the non-negotiable expenses that keep the lights on, the grounds clean, and the tenants happy.
Investor Takeaway: Digging into the operating expenses is where you discover a sponsor's real operational chops—or their overly rosy projections. A seasoned operator knows these numbers cold and can often spot efficiencies others completely miss.
The image below shows how it all comes together.
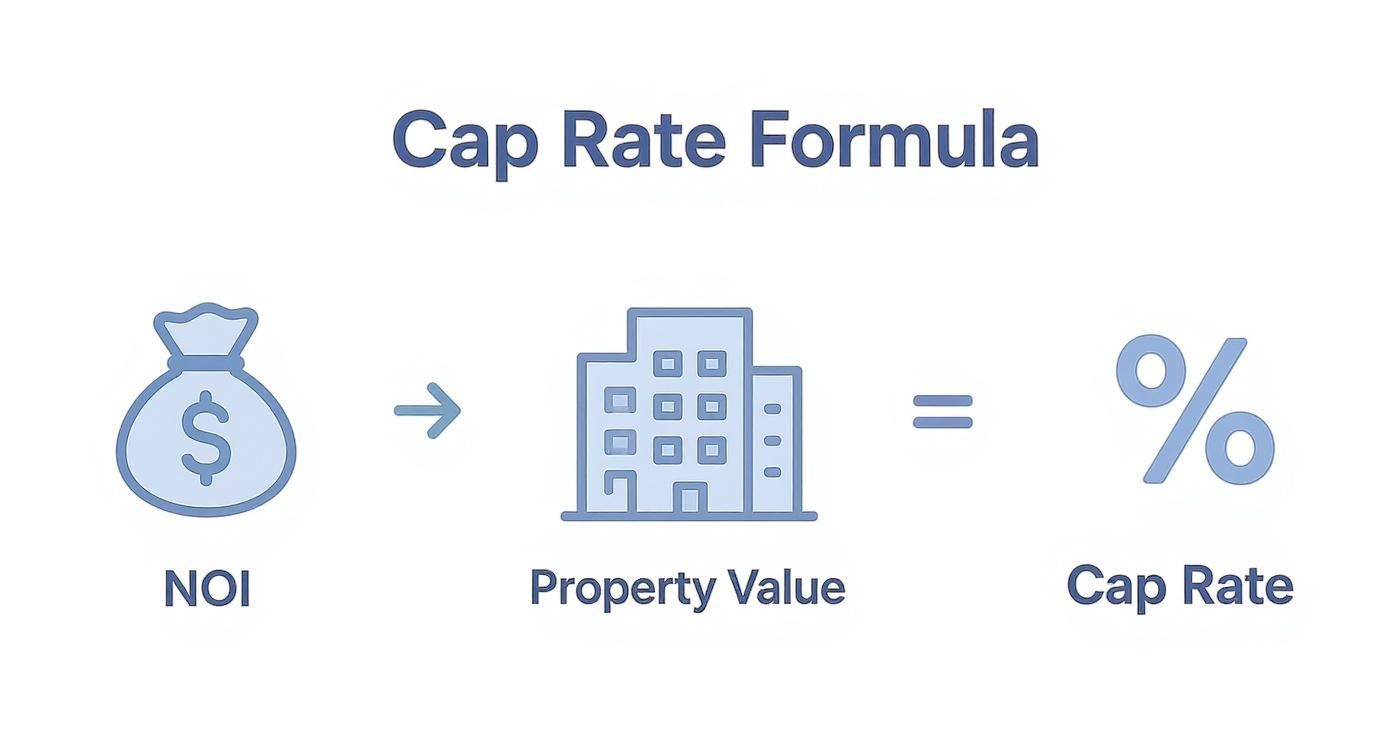
This simple flow—dividing what the property earns (NOI) by what it's worth—is the heart of the cap rate.
Typical operating expenses to subtract include:
Property Taxes
Property Insurance
Utilities (if not paid directly by tenants)
Repairs & Maintenance
Property Management Fees
Administrative & Marketing Costs
What NOT to Include in Operating Expenses
Knowing what to exclude is just as critical. These items are considered "below the line" because they have more to do with the investor's financing and tax situation than the property's daily performance.
Debt Service (Mortgage Payments): NOI is always calculated before debt. This lets you compare properties on an apples-to-apples basis, regardless of how they’re financed.
Capital Expenditures (CapEx): Huge one-off projects, like replacing a roof or an entire HVAC system, are handled separately from routine maintenance.
Depreciation: This is a "paper" expense for tax purposes; no actual cash leaves the building.
Income Taxes: Your taxes are unique to your financial situation, not the property itself.
Once you have that carefully calculated NOI, you can plug it into the cap rate formula. For a deeper dive, check out our guide on how to find Net Operating Income for real estate investors.
Here's a quick example: if a building generates $750,000 in annual NOI and is worth $10,000,000, its cap rate is a straightforward 7.5%.
Putting the Cap Rate Formula Into Practice
Now that you have a solid handle on Net Operating Income (NOI), let's put the full capitalization rate real estate formula to work. This is where the rubber meets the road—turning theory into action to quickly size up a property's performance and market value.
Think of the formula as a two-way street. You can use it to find the cap rate when you know the price, or you can flip it around to determine a property's value when you know the going market cap rate.

Calculating a Property's Cap Rate
This is the most common way you'll see the formula used. You have an asking price and the property's income figures, and your goal is to figure out the rate of return at that price.
Formula:
Let’s run the numbers on a stabilized industrial warehouse in a growing Sunbelt market.
Net Operating Income (NOI): $800,000 per year
Property Value (Asking Price): $12,300,000
Here’s the calculation:
The property is being offered at a 6.5% cap rate. That number is now a crucial benchmark you can use to compare this deal against other industrial assets in the same market.
Determining a Property's Value
Flipping the formula is just as powerful. If you know what cap rates similar properties are trading for, you can quickly get a back-of-the-napkin estimate of what a target asset is worth based on its income. This is exactly how investors and appraisers establish a baseline valuation.
Formula:
Imagine you’re analyzing a 150-unit multifamily community.
Net Operating Income (NOI): $1,200,000 per year
Market Cap Rate: Your research shows comparable apartment buildings in the submarket are consistently selling at a 5.0% cap rate.
Plug in the numbers:
Based on its income and what the market is paying, the property's estimated value is $24,000,000. If it’s listed for $28 million, you know it’s priced above market. If it’s listed for $21 million, you might have just found an opportunity that deserves an immediate, deeper look.
Trailing vs. Pro-Forma: An Essential Distinction
Be warned: not all NOIs are created equal. When a sponsor presents a cap rate, one of the first questions any sharp investor asks is, "What period is that NOI based on?"
Trailing Cap Rate: This is based on historical data, usually the last 12 months of performance (often called the "T-12"). It’s a reflection of actual, verified results, making it a reliable snapshot of what has happened.
Pro-Forma Cap Rate: This uses projected future income. A sponsor might use a pro-forma NOI to show what the property could earn after they execute their business plan of raising rents or cutting costs.
Novice Lens: Think of a trailing cap rate like a company's reported earnings from last year—it’s factual. A pro-forma cap rate is like an analyst’s forecast for next year’s earnings—it’s an educated guess that is only as good as the assumptions behind it.
While pro-forma numbers are crucial for any value-add strategy, they carry more risk and demand serious scrutiny. Those assumptions must be grounded in reality and backed by hard market data. Understanding the capitalization rate for rental property in depth helps you ask the right questions about these projections.
Advanced Lens: Forcing Appreciation by Driving NOI
This is the very heart of value-add real estate investing. While you can't control market cap rates, you absolutely can influence a property's NOI. Sophisticated sponsors don't just "buy" a cap rate; they actively work to create a better one.
The real opportunity isn't just hoping the market tightens and cap rates compress (which would increase the property's value). The true strategy is to aggressively increase the NOI through smart, targeted operational improvements.
Let's go back to our multifamily example. The property has a $1,200,000 NOI and is worth $24,000,000 at a 5.0% market cap rate.
A skilled operator, however, sees a clear path to boost the NOI to $1,500,000 over two years through unit renovations, smarter expense management, and adding new income-generating amenities.
Even if the market cap rate stays flat at 5.0%, the property's new value becomes:
By driving the NOI up by $300,000, the sponsor has created $6,000,000 in new equity. This is called "forcing appreciation," and it's how the best operators generate outsized returns, regardless of what the broader market is doing.
How to Interpret Cap Rates in Today's Market
A cap rate by itself is just a percentage on a spreadsheet. Its real power comes alive when you put it in context—sizing it up against the market, the specific type of property, and the broader economic mood. Learning to read this number is what separates a novice from a seasoned pro who can hear the subtle stories the market is telling.
First, let's bust a common myth: there is no universal "good" cap rate. A 4.5% cap rate might be a fantastic deal for a brand-new apartment building in a booming Sunbelt city. At the same time, a 9% cap rate could be a massive red flag on a struggling retail center in a declining area.
The number is always relative.
The Inverse Relationship Between Risk and Cap Rates
The most fundamental concept here is the seesaw relationship between cap rates, risk, and value. It’s a crucial dynamic that dictates how properties get priced.
Investor Takeaway: A low cap rate generally points to a higher property value and lower perceived risk. A high cap rate suggests a lower property value and higher perceived risk—or, for the right operator, a major value-add opportunity.
Think of it this way: investors are willing to pay a premium for safety and predictability, which pushes the cap rate down. They'll accept a lower initial return for a stable, high-quality building in a prime location. On the flip side, they demand a higher potential return (a higher cap rate) to compensate them for taking on the risks of an older property, a shakier location, or a more volatile asset class.
Reading the Market's Current Signals
To make this tangible, let’s look at what the market has been telling us.
Market Signal Box (As of Q2 2024)* The Data: Cap rates have expanded (risen) across most major property types over the last 18 months. According to CBRE, multifamily cap rates for stabilized, Class A assets in prime markets have moved from the low 4% range to the 5.0% - 5.75% range.* Our Interpretation: This isn't a sign of operational distress. It's a rational market adjustment to the higher cost of debt. As interest rates climbed, the "spread" between a property's cap rate and its borrowing cost evaporated, forcing buyers to demand a higher initial yield to make deals pencil out.* Investor Take: This environment favors well-capitalized investors and skilled operators who can acquire assets at more attractive entry points and create value through operational improvements, rather than relying on cheap leverage or market appreciation.
Knowing where to invest in this environment is critical, which is why we’re constantly analyzing the best markets for real estate investment.
Illustrative Cap Rate Benchmarks by Property Type
Cap rates vary widely from one asset class to another, reflecting the unique risks, growth potential, and operational headaches of each. The table below gives you some useful benchmarks to frame what you might encounter out in the wild.
This table provides estimated cap rate ranges for various commercial real estate asset classes in major U.S. markets, illustrating how risk, stability, and growth expectations influence valuation.
Property Type | Typical Cap Rate Range | Key Influencing Factors |
|---|---|---|
Multifamily (Class A) | 5.0% - 5.75% | Driven by strong rental demand, perceived stability, and inflation-hedging qualities. Market fundamentals are paramount. |
Industrial / Logistics | 4.75% - 5.50% | Benefiting from e-commerce tailwinds and supply chain resilience. Proximity to distribution hubs commands a premium. |
Neighborhood Retail | 6.5% - 7.5% | Value is tied to tenant credit quality (e.g., grocery anchors), location, and resilience to e-commerce disruption. |
Medical Office | 6.0% - 7.0% | Supported by demographic trends and the stability of healthcare tenants, often with long-term leases. |
Hospitality (Full Service) | 7.5% - 8.5%+ | Higher cap rates reflect greater operational complexity and sensitivity to economic cycles and travel trends. |
Note: These are illustrative ranges as of Q2 2024 and can vary significantly based on specific submarket, asset quality, and lease terms. Source: Aggregated industry data from firms like JLL and Cushman & Wakefield.
Understanding these benchmarks transforms you from someone who can simply plug numbers into a formula into an investor who understands the market’s language. You start to see not just the number, but the story of risk, opportunity, and value it represents.
Digging Deeper: Advanced Cap Rate Concepts and Common Pitfalls
Once you've got the basic capitalization rate real estate formula down, you’re ready to look at the more dynamic forces that really move the needle on property values. A cap rate isn't some static number you just plug into a spreadsheet; it’s a living metric that breathes with the market. Getting a feel for its movements—and the common traps investors stumble into—is what separates the pros from the amateurs.
Beyond a single property’s performance, broader market trends are constantly at play. These shifts are what we call cap rate "compression" or "expansion," and they're two sides of the same powerful coin.
Cap Rate Compression and Expansion
Think of these terms as describing the overall mood of the real estate market.
Cap Rate Compression: This is what happens when property values climb faster than the Net Operating Income (NOI) they produce. Picture a hot market where investor demand is through the roof. Buyers are willing to pay a premium for the same income stream, which "compresses" or pushes the cap rate down. If you’re a property owner, this is fantastic news—it’s like a market-wide appraisal bump for your asset.
Cap Rate Expansion: This is the exact opposite. When things like rising interest rates or economic jitters make investors nervous, they start demanding a higher return for the risk they’re taking. This pushes cap rates up, or "expands" them, putting downward pressure on property values. It's exactly what we’ve seen in many markets recently as the cost of debt shot up.
Cap rate compression was the story of the last decade, dramatically shaping investment returns. As property values soared while rental income grew more slowly, the cap rate formula naturally produced lower and lower percentages. We saw this play out in major cities all through the 2010s and into the early 2020s. For a deeper dive, check out how market dynamics impact real estate returns on Landlord Studio.
Pitfall: The Overly Optimistic Exit Cap Rate
Here’s one of the biggest red flags in any real estate deal memo: the exit cap rate. This is the rate a sponsor projects they will sell the property for down the road. A rosy (meaning, aggressively low) exit cap rate can make projected returns look incredible on paper, but it’s a gamble.
If an operator buys a building at a 5.5% cap rate today and models a sale at a 4.5% cap rate in five years, they aren’t just betting on their own business plan. They're betting that the entire market will be significantly hotter when they sell. If they're wrong and cap rates expand to 6.0%, that projected value can vanish in a puff of smoke, taking investor returns with it.
Insight Edge: Underwriting with a Margin of SafetyAt Stiltsville Capital, we build our underwriting on a foundation of caution. We always stress-test our deals by assuming an exit cap rate that is higher than today’s market rate. This conservative approach forces us to create real value—driving NOI growth through smart operations—instead of just hoping the market will bail us out. Our returns are built on skill, not just luck.
Checklist: Key Questions to Ask a Sponsor About Cap Rates
To protect yourself, you need to ask the right questions. Here’s what you should be digging into:
On Acquisition: Is that going-in cap rate based on the actual numbers from the last 12 months, or is it a pro-forma fantasy? If it's pro-forma, get specific: how are they justifying that rent growth and those expense savings?
On Market Comps: Ask for the exact comparable sales they're using to justify their cap rate assumptions. Are those properties truly "apples-to-apples" in location, quality, and age?
On the Exit Strategy: What’s the projected exit cap rate, and how does it stack up against the entry cap? What has to happen in the economy for that exit number to become a reality?
On Sensitivity Analysis: Ask to see a sensitivity analysis. What happens to the deal if exit cap rates expand by 50 or 100 basis points (0.50% to 1.00%)? A solid operator will have this ready.
On NOI Integrity: How are they accounting for future capital expenditures? An NOI that doesn't include reserves for a new roof or HVAC system isn't telling the whole story about the property's cash flow.
When you move beyond simple calculations and start scrutinizing the assumptions behind the numbers, you're investing like a professional. It’s how you protect your capital and find partners who operate with the discipline and foresight required for long-term success.
Using Cap Rates to Build a Winning Investment Strategy
Getting a handle on the cap rate formula is a must, but it’s really just the price of admission. For savvy investors, the cap rate isn’t some static number you file away—it’s a dynamic part of a much bigger game plan. Real wealth isn't built by simply "buying" a cap rate; it's forged by a clear vision for creating value and the operational chops to bring it to life.
Think of the entry cap rate as your baseline. It tells you if you're paying a fair price for a property based on how it’s performing right now. The real magic, though, happens after the deal closes.
The Power of Yield-on-Cost
For any value-add investor, the ultimate goal is to blow the initial cap rate out of the water by maximizing the yield-on-cost. This metric is where the rubber meets the road—it measures the property’s stabilized NOI against your total project cost, which includes both the purchase price and every dollar you put into renovations.
A winning strategy can take a property you bought at a 6% cap rate and, through smart improvements and tight management, push its yield-on-cost to 8% or even higher.
This isn’t wishful thinking. It’s the result of a disciplined plan to drive up NOI, which usually involves a few key moves:
Strategic Renovations: Giving units and common areas a facelift to justify higher rents.
Operational Efficiencies: Cutting down on waste and unnecessary expenses with better management or new tech.
New Revenue Streams: Finding untapped income sources, like adding paid parking, storage units, or in-unit laundry.
A Holistic View of Returns
As critical as it is, the cap rate doesn't tell the whole story. It’s just a snapshot in time that completely ignores financing, appreciation, and the time value of money. That's why we always look at it alongside other key metrics to get a full 360-degree view of an investment's potential.
Internal Rate of Return (IRR): This is the big one. IRR calculates your total annualized return, factoring in your initial cash, all the cash flow you receive during the hold period, and the final payout when you sell.
Equity Multiple: This is a simple but powerful one: how many times do you get your money back? An equity multiple of 2.0x means you doubled your initial investment.
Investor Takeaway: The cap rate formula gives you your starting point, but metrics like IRR and Equity Multiple define the finish line. A winning strategy is the executable business plan that connects the two.
The way investors use this formula keeps evolving. While the basic calculation is still a cornerstone, today’s pros incorporate growth expectations right into their analysis. A more dynamic approach frames the Capitalization Rate as the Expected Return minus the Income Growth Rate, acknowledging that a property’s cash flow is almost never static. You can discover more insights about these advanced cap rate calculations at Origin Investments.
At the end of the day, a formula is just a tool. Real, lasting value is created when disciplined underwriting and a forward-looking strategy turn sharp analysis into a high-performing asset. Well-structured real estate can be a prudent, resilient component of a long-term wealth strategy, and understanding the tools of the trade is the first step.
Let's Build Your Real Assets Portfolio
Understanding the capitalization rate real estate formula is a key step in evaluating opportunities. The next is finding a partner with the discipline and experience to execute.
If you are an accredited investor exploring passive allocations in institutional-quality real estate, we invite you to connect with our team.
Schedule a confidential call with Stiltsville Capital to discuss your portfolio goals and our current opportunities.
Information presented is for educational purposes only and does not constitute an offer to sell or a solicitation of an offer to buy securities. Any offering is made only through definitive offering documents (e.g., private placement memorandum, subscription agreement) and is available solely to investors who meet applicable suitability standards, including “Accredited Investor” status under Rule 501 of Regulation D. Investments in private real estate involve risk, including loss of capital, illiquidity, and no guarantee of distributions. Past performance is not indicative of future results.
Comments