How to Find a Cap Rate: A Quick Guide for Investors
- Ryan McDowell

- Nov 13, 2025
- 16 min read
Reading Time: 8 min | Good for: Novice Investors (A), Family Office Principals (B)
TL;DR: Key Takeaways
The Formula: To find a cap rate, divide a property's Net Operating Income (NOI) by its purchase price. This gives you an unlevered snapshot of its potential annual return.
Why It Matters: The cap rate is an indispensable first-pass filter used by investors to quickly compare different opportunities and gauge market sentiment. A lower cap rate typically signals higher value and lower risk, while a higher cap rate suggests lower value, higher risk, or potential upside.
Your Next Step: A cap rate is only as reliable as its inputs. The key to smart investing is rigorously challenging the seller's income and expense figures and benchmarking them against credible market data.
At its core, finding a cap rate is straightforward: you divide a property's Net Operating Income (NOI) by its current Market Value. This simple formula gives you a powerful, unlevered snapshot of a property’s potential annual return, creating a standardized way for investors to compare different opportunities on an apples-to-apples basis.
What a Cap Rate Really Tells You
Before we get into the number-crunching, it’s crucial to understand what the capitalization rate actually reveals. Think of it as a property's vital sign—a quick, unfiltered measure of its earning potential relative to its price, completely stripped of any financing.
It answers the most fundamental question for any investor: "What is this property earning based on its market price, before I factor in any mortgage payments?"
This isn't just theory. For new investors, getting this concept down builds a confident foundation for evaluating deals. For seasoned family offices and institutional funds, the cap rate is the indispensable first-pass filter they use to quickly size up risk, opportunity, and market sentiment across a pipeline of potential acquisitions.
The Core Concept: A Simple Analogy
Imagine you're buying a small, profitable business that generates $100,000 a year in clear profit. If you pay $1 million for it, your initial annual return is 10% ($100,000 / $1,000,000). That 10% is your cap rate. It’s the raw, unlevered yield on your capital.
Now, a different buyer might only be willing to pay $800,000 for that same business, demanding a 12.5% cap rate. The business itself hasn’t changed, but the market's perception of its value and required return has. This is exactly how cap rates work in real estate—they are a direct reflection of market sentiment and perceived risk.
Investor Takeaway: A lower cap rate generally signals a higher property value and lower perceived risk (think a prime asset in a gateway city). On the flip side, a higher cap rate suggests a lower property value, higher perceived risk, or perhaps some untapped growth potential that hasn't been realized yet.
Beyond the Basic Formula
The standard formula has become the go-to for real estate investors everywhere. For example, if a multifamily property generates $50,000 in annual NOI and is valued at $500,000, the cap rate is 10%. Simple math, and it lets you quickly benchmark an asset against your own financial goals.
For a deeper dive into the fundamentals, you can check out our comprehensive guide to capitalization rates for real estate investors.
However, true institutional-grade analysis goes way beyond just plugging numbers into a calculator. The real skill is in tearing apart the inputs of that formula. An inflated NOI or an unrealistic market value can make a bad deal look good on paper.
That’s why the cap rate isn't the final answer. It’s the starting point for rigorous due diligence. It frames the conversation and points your focus toward the most critical questions about income stability, expense management, and where the property really sits in the market.
Calculating Your Inputs with Institutional Discipline
A cap rate is only as reliable as the numbers you feed into it. Moving from theory to practice requires a disciplined, almost forensic approach to your calculations. "Garbage in, garbage out" is the unforgiving rule of underwriting, and getting this part right is what separates a speculative bet from a sound investment.
It all boils down to two core inputs: Net Operating Income (NOI) and Market Value.
This visual breaks down the simple but powerful relationship between a property's income, its value, and the resulting cap rate.
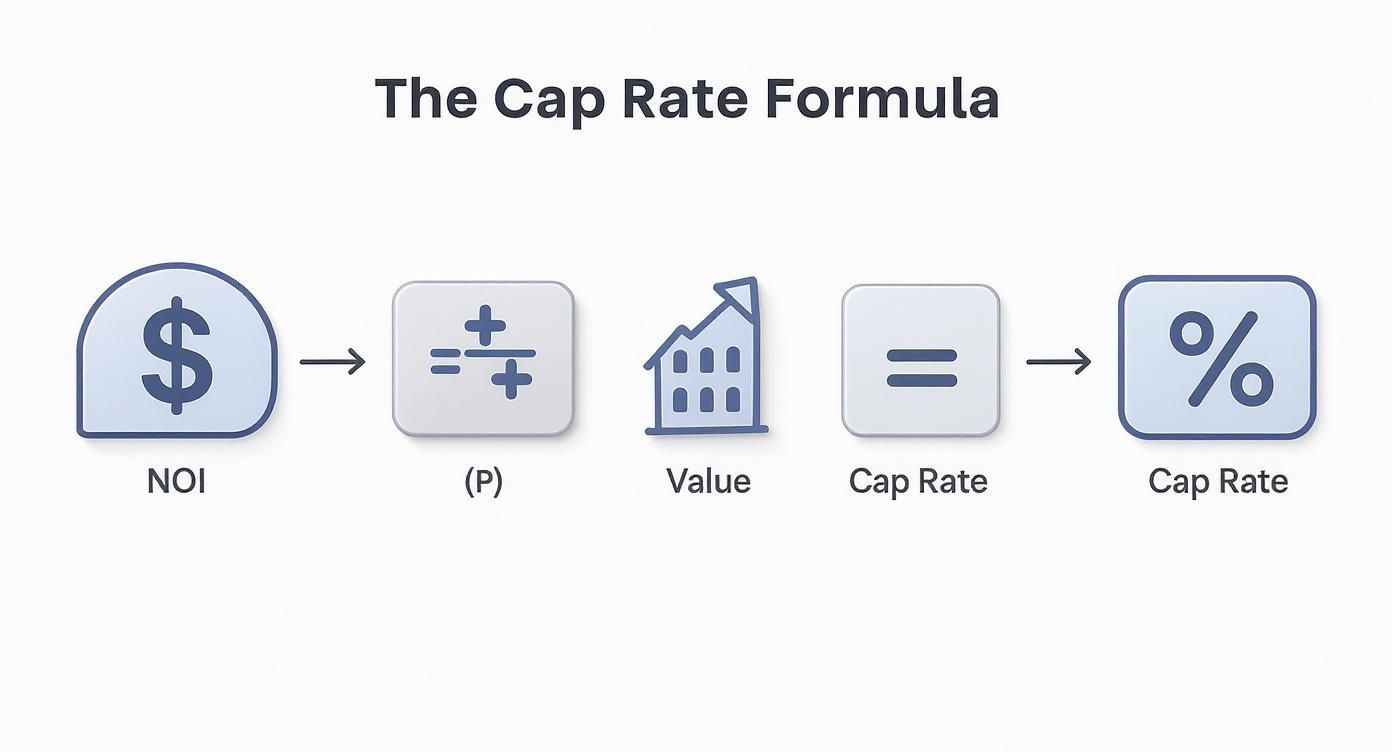
As you can see, NOI is the engine that drives the entire valuation. Its accuracy is absolutely critical.
Deconstructing Net Operating Income
NOI is more than just rent collected minus bills paid. A professional analysis starts with Gross Potential Income (GPI)—the absolute maximum income a property could generate if it were 100% occupied and every single tenant paid on time. A perfect world, right?
From there, we have to make realistic deductions for the realities of property ownership:
Vacancy & Credit Loss: No building stays full forever, and sometimes tenants don't pay. We subtract a market-standard rate (often 5%) to account for empty units and defaults.
Operating Expenses (OpEx): These are the non-negotiable costs of keeping the lights on. Think property taxes, insurance, management fees, utilities, routine repairs, and administrative costs.
One of the biggest mistakes new investors make is forgetting about future capital expenditures. A sophisticated analysis always includes a line item for replacement reserves to set aside funds for big-ticket items down the road, like a new roof or an HVAC overhaul.
For a deeper dive into this crucial metric, check out our complete guide on how to find net operating income.
Here’s a simplified example of how these pieces fit together to arrive at a credible NOI.
Illustrative Net Operating Income (NOI) Calculation
Income/Expense Item | Annual Amount ($) | Notes for Investors |
|---|---|---|
Gross Potential Rent | $120,000 | Assumes 10 units at $1,000/month. |
Less: Vacancy & Credit Loss (5%) | ($6,000) | A standard assumption. Verify against local market data. |
Effective Gross Income (EGI) | $114,000 | This is your realistic top-line revenue. |
Less: Operating Expenses | ||
Property Taxes | ($15,000) | Crucial: Will this be reassessed higher after the sale? |
Insurance | ($5,000) | Get a fresh quote; don's rely on the seller's old policy. |
Property Management (8% of EGI) | ($9,120) | Even if self-managing, underwrite this cost. Your time isn't free. |
Repairs & Maintenance | ($6,000) | Scrutinize the seller's numbers for deferred maintenance. |
Utilities | ($7,500) | Review historical bills for accuracy. |
Total Operating Expenses | ($42,620) | |
Net Operating Income (NOI) | $71,380 | The final figure used to calculate the cap rate. |
This table shows how a property’s potential income is systematically reduced by real-world costs to arrive at the NOI, the true measure of its profitability before debt service.
The Investor Lens: Normalizing a Seller’s P&L
Here’s a pro tip: never accept a seller’s provided Profit & Loss (P&L) statement at face value. A seller's pro-forma is a marketing document, often painting an overly optimistic picture with pie-in-the-sky rents and minimized expenses.
Institutional Discipline in Action: We once analyzed a multifamily deal where the owner was self-managing and not paying themselves a salary, making the NOI appear artificially high. We "normalized" the P&L by adding a line item for a market-rate third-party management fee (4% of effective gross income). This single adjustment lowered the NOI and increased the true cap rate by 50 basis points, revealing a much more accurate valuation.
Your job is to re-underwrite the deal with your own conservative, market-based assumptions. Ask tough questions:
Are the property taxes based on the current assessed value or the future, post-sale value? A sale almost always triggers a reassessment.
Are the insurance premiums about to jump on renewal?
Is the seller’s maintenance budget realistic, or are they just kicking the can down the road on critical repairs?
To make sure your cap rate is built on a solid foundation, you first have to master your income projections. This resource on how to calculate rental income accurately can help.
Defining Property Value
The second input, "Value," can be just as slippery. It’s important to know which number to use:
Asking Price: What the seller wants for the property.
Appraised Value: A third-party appraiser's opinion of value, usually for a lender.
Purchase Price: The actual, negotiated price you pay for the asset.
For calculating your going-in cap rate, you must use the Purchase Price. This is your true cost basis. Using the asking price or a future appraised value will give you a flawed analysis of your initial return from day one.
Finding Reliable Market Cap Rate Data
Figuring out a property’s cap rate in a spreadsheet is a clean, academic exercise. But that number is totally meaningless in a vacuum. To know if you’ve found a genuine opportunity or a dangerous outlier, you have to benchmark it against the market. This is less about calculation and more about investigation—digging up credible, comparable data to frame your investment thesis.
An accurate market benchmark is the context that turns a simple number into actionable intelligence. It’s the difference between knowing your assumptions are grounded in reality versus just wishful thinking.

Sourcing Institutional-Grade Data
For accredited investors and family offices, getting your hands on reliable data is the first step toward disciplined underwriting. No single source is perfect, so the real pros combine insights from several channels to get the full picture.
Subscription Data Services: Platforms like CoStar, Real Capital Analytics (RCA), and Yardi Matrix are the gold standard. They give you aggregated data on closed sales, property specifics, and market trends, letting you slice and dice by submarket, asset class, and building quality.
Major Brokerage Research Reports: Big firms like CBRE, JLL, and Cushman & Wakefield publish quarterly market reports that are invaluable. They’re great for getting a handle on macro trends, investor sentiment, and average cap rates in major markets.
On-the-Ground Broker Intelligence: Never, ever underestimate a well-connected commercial real estate broker. A top broker in your target market can give you real-time color on deals that are in contract but haven’t closed yet—intel you won’t find in any database.
Why a Single Data Point Is a Rookie Mistake: Relying on a single reported market cap rate is a classic error. That average you saw could be skewed by a one-off distressed sale or a shiny trophy asset. Real analysis means building a range based on a set of carefully chosen comparable sales, or "comps."
Deal Lens: Pulling Comps for a Multifamily Asset
Let’s make this real. Imagine you’re analyzing a 20-unit, Class B multifamily property in Austin, Texas. Your spreadsheet spits out a going-in cap rate of 5.75%. Is that a good deal? To find out, you need to build a set of comps.
You’d start by pulling data on all sales of 15-30 unit, Class B multifamily assets in the same or adjacent submarkets that have closed in the last six to nine months.
But the raw data isn't enough. Now you have to make some qualitative adjustments:
Location: Is your property on a better street than a comp that sold at a 5.5% cap rate? You might be able to justify a slightly lower, more aggressive cap rate for your asset.
Condition: Does your property need a $200,000 roof replacement, while a comp that sold for a 6.0% cap was just renovated? Your asset is clearly riskier and should command a higher cap rate to compensate.
Tenant Profile & Leases: Are your rents way below market, offering some immediate upside? This could justify paying a lower initial cap rate compared to a fully stabilized building already charging top dollar.
After digging into five to seven relevant comps and making these kinds of adjustments, you might conclude that the defensible market cap rate range for your target property is 5.4% to 5.9%. Your calculated 5.75% falls right in the middle of that range. This validates your valuation and gives you the confidence to move forward.
While you're doing deep, property-specific research, it can also be helpful to use broader estimation tools to supplement your work. Platforms like the microestimates platform can offer additional market data points. This multi-layered approach ensures your analysis is both broad and deep, protecting your capital from oversimplified assumptions.
Using Cap Rates to Compare and Decide
Once you’ve nailed down a property's cap rate and stacked it up against the market, the real work begins. This is where you graduate from number-crunching to making strategic decisions. The cap rate becomes your lens for sizing up risk, return, and opportunity—a powerful tool for picking the right investment for you.
At its core, a cap rate is a great equalizer. It lets you create an apples-to-apples comparison between properties with wildly different price tags and income streams. Suddenly, a $250,000 property pulling in $15,000 of NOI (a 6% cap rate) and a $500,000 property generating $30,000 of NOI (also 6%), look identical from a return perspective. For a deeper dive on how market dynamics shape these numbers, you can discover more insights about cap rates on pnc.com.
Unpacking the Risk-Return Trade-Off
Let’s play out a scenario I see all the time. You’re looking at two different multifamily deals:
Property A: A Class C building in an up-and-coming neighborhood, offered at a 7.5% cap rate. The rent roll is a bit shaky, and you know it needs some capital improvements right away.
Property B: A buttoned-up Class A building in a top-tier market, priced at a 4.5% cap rate. It’s got high-quality tenants and needs practically zero work in the short term.
A rookie investor might immediately go for Property A, thinking the higher cap rate means it’s a better "deal." But seasoned pros see the trade-off for what it is. That 300-basis-point difference is what the market is charging for risk.
The 7.5% cap is your compensation for taking on higher vacancy risk, renovation headaches, and uncertain rent growth. On the flip side, the 4.5% cap reflects the stability and security that come with a premium asset in a high-demand area. Neither is automatically better—it all comes down to your personal risk tolerance and what you’re trying to achieve.
Introducing the Cap Rate Spread
Here's a simple but powerful metric that often gets overlooked: the cap rate spread. It's just the difference between your property’s cap rate and your loan's interest rate. This little calculation is a fantastic indicator of your immediate cash flow potential.
Investor Takeaway: A wider cap rate spread is a good thing. It usually points to stronger positive leverage and more cash in your pocket from day one. Say you buy at a 6% cap rate and your interest rate is 4.5%—your spread is a healthy 1.5%. But if that spread turns negative, you’re writing a check every month just to pay the mortgage.
Think of the spread as a quick health check on your deal. When interest rates are climbing, a skinny spread can disappear in a hurry, turning a profitable investment into a cash-draining liability. Always stress-test your numbers to see how a rate hike would hit your bottom line.
Questions to Ask a Sponsor About Their Exit Cap Rate
This might be the most important use of cap rates: vetting a sponsor's projections. The exit cap rate—the cap rate they assume they'll sell the property for down the road—is a massive driver of your total return. An overly rosy (meaning, too low) exit cap can make a dud of a deal look like a grand slam.
Don't be shy. Before you invest, here’s what you need to ask the sponsor:
How did you land on your exit cap rate assumption? Make them show you the comps and market data they used to back it up.
What’s the spread between your going-in cap and your exit cap? If they're planning to sell at a lower cap rate than they bought at (this is called cap rate compression), they better have a darn good story about massive market growth or a serious property transformation.
Did you run a "sensitivity analysis" on the exit cap? Ask to see what the returns look like if the exit cap is 50 or 100 basis points higher (worse) than they've projected. A solid deal should still hold up, even if things don't go perfectly to plan.
Arming yourself with these questions changes the game. You're no longer just a passenger along for the ride; you become an engaged, informed partner in the investment.
Beyond the Basics: Advanced Analysis and Avoiding Costly Mistakes
The cap rate is a fantastic starting point, but it's just that—a start. Relying on it blindly, without digging deeper, is where even experienced investors get into trouble. This is where we shift from simple math to the kind of institutional discipline that protects your capital and uncovers real value.
One of the most common—and damaging—mistakes I see is applying a broad market cap rate to a specific property without making critical adjustments. A tired, half-empty building with a leaky roof is worlds apart from the fully leased, recently renovated property next door. They simply shouldn't trade at the same cap rate, yet it happens all the time.
The only way to protect yourself is to re-underwrite every deal from scratch, using your own conservative assumptions. You have to challenge every single line item on the seller's pro-forma.
Spotting Red Flags and Mitigating Risk
An investment’s success often boils down to the mistakes you don't make. Misinterpreting cap rate data can easily cause you to overpay or, worse, underestimate the true risks of an asset. Knowing what to look for is half the battle.
Here are the most common dangers we see and the institutional-grade defenses we use to counter them.
Risk: Trusting a seller's inflated "pro-forma" numbers. * How to fix it: Rebuild the entire operating statement yourself. Plug in realistic, market-rate expenses for things like property management (even if you plan to self-manage), verify what property taxes will be after the sale, and bake in a healthy reserve for future capital projects.
Risk: Using a generic market cap rate to value a property. * How to fix it: Forget market-wide averages. Find a tight group of 3-5 highly relevant comparable sales (comps) that have closed in the last six months. These should mirror your target property in age, condition, location, and even tenant quality.
Risk: Ignoring the real cost of deferred maintenance. * How to fix it: Get a professional property condition assessment before you close. The cost of that new roof or HVAC system isn't just a future problem; it's a present-day cost. Subtract it directly from your offer price to get to the property's true "as-is" value.
Investor's Edge: A cap rate should reflect a property’s current, in-place performance—not its pie-in-the-sky potential. You, the investor, are the one creating that future value. Paying the seller for it upfront kills your upside before you even start.
Advanced Concepts: Cap Rate Compression and Expansion
For anyone serious about real estate, understanding the dynamic dance between cap rates, interest rates, and property values is non-negotiable. This is where we get into cap rate compression and cap rate expansion.
These aren't just Wall Street buzzwords; they have a direct and powerful impact on your exit valuation and your total return.
Cap Rate Compression: This is when cap rates in a market go down. Because of the inverse relationship in the formula (Value = NOI / Cap Rate), a lower cap rate pushes property values up, even if your income stays flat. Compression usually happens in a strong economy with low interest rates and a flood of investor demand. It's a great tailwind if you already own property.
Cap Rate Expansion: This is the opposite—and it can be painful. When cap rates rise, property values fall. Expansion is often triggered by rising interest rates (making debt more expensive), a slowing economy, or overbuilding, which sours investor sentiment.
Let's see how this plays out. Say you buy a property with $100,000 in NOI at a 6% cap rate. Your purchase price is $1.67 million. You plan to sell in five years.
Scenario 1 (Compression): The market heats up. By the time you sell, similar properties are trading at a 5.5% cap rate. Your property is now worth $1.82 million ($100,000 / 0.055). That's a $150,000 gain from market movement alone.
Scenario 2 (Expansion): The Fed raises rates and the market cools off. Exit cap rates have expanded to 7%. Your property is now worth just $1.43 million ($100,000 / 0.07), putting you in the red.
This is exactly why a deal sponsor's exit cap rate assumption is one of the most important things to scrutinize in their financial model. Prudent operators will always underwrite a slightly higher exit cap rate than the going-in rate. This builds in a conservative cushion against future market shifts. An aggressive model that assumes significant cap rate compression is a major red flag.
FAQ: Your Cap Rate Questions Answered
Even after you’ve got the mechanics down, using cap rates in the real world always brings up a few practical questions. Let’s tackle some of the most common ones we hear from investors so you can move forward on your next deal with confidence.
What’s a Good Cap Rate?
This is the million-dollar question, and the answer is always: it depends. A cap rate is completely relative and only makes sense in context. Whether a cap rate is "good" or not hinges on the asset class, location, property condition, and what’s happening in the broader economy.
For instance, a 4% cap rate might be an excellent deal for a shiny, new Class A apartment building in a hot market like Miami or Austin. That low number signals intense investor demand, low perceived risk, and a strong belief in future appreciation.
On the other hand, you might be looking for a 7% or 8% cap rate on a Class B value-add deal in a smaller, secondary market. That higher cap rate is your reward for taking on more risk—things like potential tenant turnover, renovation headaches, and less certain rent growth.
The Bottom Line: A "good" cap rate is simply one that pays you fairly for the specific risks of an asset, measured against what similar properties have actually sold for in that same neighborhood.
How Do Interest Rates Affect Cap Rates?
Think of interest rates and cap rates like two ends of a seesaw. They generally move in opposite directions, a dynamic that’s absolutely critical for any long-term real estate strategy.
When interest rates go up, so does the cost of borrowing money. This cools down investor demand because financing gets more expensive, and buyers can't pay as much. To hit their target returns, investors will demand a higher yield, which pushes cap rates up.
The reverse is also true. When interest rates fall, debt gets cheaper. This tends to fire up investor appetite, creating more competition and pushing property prices higher. As a result, cap rates usually go down, or "compress." This relationship is a huge deal when you’re trying to predict your exit value years down the road, as a changing rate environment can dramatically impact what your property will be worth.
How Should I Use Cap Rates for a Value-Add Property?
This is where you need to be careful. A standard cap rate is most accurate for a stabilized property with predictable income. A value-add asset, by its very nature, is an underperformer.
That’s why experienced investors always look at two different numbers:
The "Going-In" Cap Rate: You calculate this using the property's current, lackluster NOI and your total purchase price. It’s often low because the income is weak, but it gives you a starting point.
The "Stabilized" or "Pro-Forma" Cap Rate: This is the important one. It’s based on the projected NOI you expect after your renovations are done and the building is leased up at full market rents.
But the most crucial metric for any value-add deal is your yield on cost. You find this by dividing your stabilized NOI by your total project cost (the purchase price plus all your renovation expenses). This number shows you the real return you're making on every dollar you put into the deal, which is the ultimate test of whether the reward is worth the risk.
Does a Cap Rate Include My Mortgage Payments?
No, and this is a really important distinction to get right. A cap rate is an unlevered metric, which means it measures a property's performance completely independent of any financing.
The Net Operating Income (NOI) formula intentionally stops before you subtract debt service (your mortgage payments). This is by design. It lets you make a clean, apples-to-apples comparison of how different properties operate, without the unique loan terms of each deal muddying the waters.
To see what your return looks like after your mortgage, you’d turn to other metrics. The most common one is the Cash-on-Cash Return, which focuses on the actual cash flow you receive after the bank has been paid.
At Stiltsville Capital, we believe disciplined underwriting is the bedrock of successful real estate investing. Understanding these nuances is key to building a resilient portfolio. If you're an accredited investor looking to access institutional-quality opportunities, we invite you to schedule a confidential call to discuss your investment goals.
Information presented is for educational purposes only and does not constitute an offer to sell or a solicitation of an offer to buy securities. Any offering is made only through definitive offering documents (e.g., private placement memorandum, subscription agreement) and is available solely to investors who meet applicable suitability standards, including “Accredited Investor” status under Rule 501 of Regulation D. Investments in private real estate involve risk, including loss of capital, illiquidity, and no guarantee of distributions. Past performance is not indicative of future results. Verification of accredited status is required for participation in Rule 506(c) offerings.
Comments