The Formula for Cap Rate in Real Estate Explained (for Accredited Investors)
- Ryan McDowell
- Dec 15, 2025
- 15 min read
Reading Time: 7 min | Good for: Novice (A), Informed (B)
TL;DR: Key Takeaways
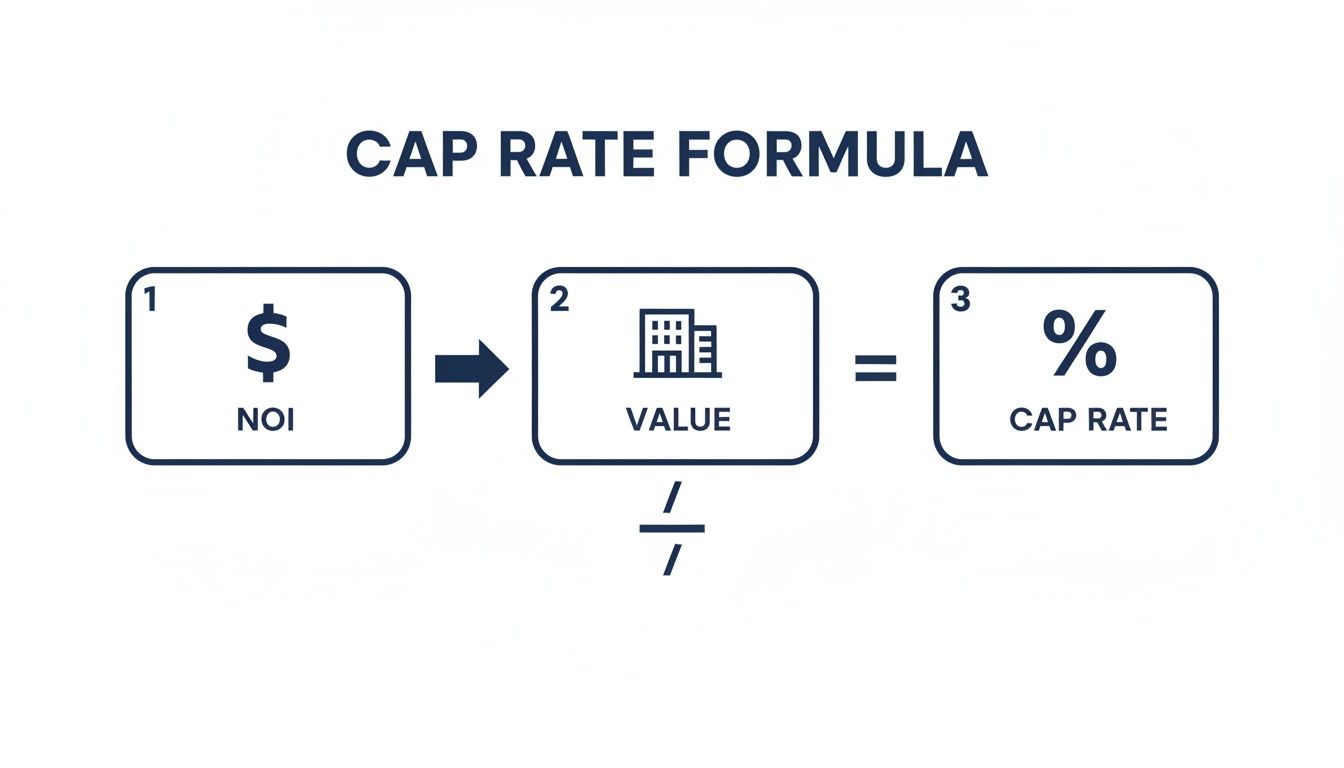
The Formula: The capitalization rate, or cap rate, is a fundamental real estate metric calculated as Net Operating Income (NOI) / Property Value. It measures the unleveraged annual return on an asset.
Why It Matters: The cap rate formula allows investors to quickly compare different properties on an apples-to-apples basis, gauge market sentiment, and assess the initial relationship between risk and return.
Beyond the Formula: The "going-in" cap rate is just the start. Sophisticated analysis focuses on the spread between the purchase cap rate and the projected "exit" cap rate, where real value is created through operational improvements.
Next Step: Understanding the cap rate is the first step. The next is pressure-testing the inputs (especially NOI) and using it as a component in a more comprehensive investment analysis.
The Market "Why Now"
In a shifting interest rate environment, understanding the cap rate formula is more critical than ever. As the cost of capital changes, so does the required return on assets. According to recent CBRE analysis (Q4 2023), cap rate expansion is evident across most U.S. commercial real estate sectors, reflecting market repricing. For investors, this creates opportunities to acquire quality assets at more attractive initial yields than were available 18-24 months ago. This makes a disciplined approach to calculating and interpreting cap rates essential for identifying value in today's market.
In the world of private real estate investing, if there’s one number you need to know, it’s the cap rate. Short for capitalization rate, this is the essential first-glance metric for any deal. It’s the universal language that investors, sponsors, and brokers use to talk about the relationship between a property’s income and its price tag.
At its core, the formula is beautifully simple: Net Operating Income (NOI) divided by the Property’s Market Value.
This single number gives you a quick, unleveraged look at a property's potential annual return. Before you even think about building a complex discounted cash flow model or calculating an IRR, the cap rate gives you a crucial snapshot.
Why the Cap Rate Formula Matters
Mastering the cap rate formula is non-negotiable for anyone serious about building a real estate portfolio. It's the first filter you'll run any potential deal through.
Here’s why it’s so critical:
Quickly Compare Opportunities: A cap rate lets you benchmark totally different properties—regardless of their size or price—on an apples-to-apples basis. Is that small multifamily deal in Austin a better buy than the industrial warehouse in Phoenix? The cap rate is your starting point.
Gauge Market Sentiment: Tracking cap rate trends in a specific city or for a certain asset class tells you a story. You can see whether property values are rising (what we call cap rate compression) or falling (cap rate expansion).
Assess Risk and Return: Generally speaking, a higher cap rate can point to higher perceived risk or a greater potential return. On the flip side, a lower cap rate often suggests a more stable, lower-risk asset in a prime location.
Why It Matters (for Novice Investors): Think of the cap rate like the miles per gallon (MPG) for a car. It doesn’t tell you everything—like how fast it accelerates or how comfortable the seats are—but it gives you a standardized, vital piece of data to start your comparison.
This metric is your entry point into the financial underwriting of a property. While it absolutely has its limitations (which we'll cover), mastering the formula for cap rate in real estate is the first step toward making disciplined, data-driven investment decisions.
For a more extensive explanation, you can delve deeper into the capitalization rate formula. In the next sections, we’ll break down each component, ensuring you can calculate and interpret this figure with institutional-grade confidence.
Calculating Net Operating Income The Right Way
The cap rate formula is only as good as its inputs. Get them wrong, and you're flying blind. The single most important number you'll plug into that formula is the Net Operating Income (NOI).
Even a small mistake here can throw off your valuation and make a bad deal look good—or a good deal look mediocre. Think of NOI as the property's pure, unfiltered annual profit from its operations. It’s the bottom line before you factor in debt or taxes.
Getting this number right is non-negotiable in serious underwriting. It’s the engine of the whole calculation.
Starting with Gross Income
The path to an accurate NOI starts with a property’s total potential income. This is way more than just looking at the current rent roll; it's about seeing the full picture.
Gross Potential Rent (GPR): This is the dream scenario. It’s the absolute maximum rent you could collect if every single unit was leased at full market rate, 365 days a year.
Other Income: Don't overlook the small stuff. Ancillary income from things like parking spots, laundry machines, pet fees, or storage units can add up and make a real difference to the bottom line.
Of course, no property is 100% full all the time. We have to bring this ideal number back down to earth by subtracting an allowance for vacancy and credit loss (for tenants who don't pay). What's left is the Effective Gross Income (EGI), a much more realistic starting point.
Deducting True Operating Expenses
Once you have your EGI, it’s time to subtract all the costs required to keep the property running day-to-day. These are the expenses that keep the lights on, the landscaping tidy, and the asset insured. You have to be meticulous here.
Common operating expenses you'll need to account for include:
Property Taxes
Property Insurance
Utilities (unless tenants pay them all)
Repairs and Maintenance
Property Management Fees
Administrative and Marketing Costs
This simple flow shows how NOI and a property's value come together to give you the cap rate.
At its core, the cap rate is a direct measure of how efficiently a property turns its market price into cold, hard cash flow.
What Not to Include in an NOI Calculation
What you leave out of the calculation is just as important as what you put in. This is where a lot of newer investors trip up. To get a clean, accurate NOI, you must exclude these items:
Debt Service: Your mortgage payments (both principal and interest) are a financing cost, not an operating one. NOI is always calculated as if you bought the property with all cash. This is what allows for a true apples-to-apples comparison between different deals.
Capital Expenditures (CapEx): These are the big-ticket, one-off upgrades that extend the life of the property, like putting on a new roof or replacing the entire HVAC system. While they are critical for your long-term budget, they aren't part of the regular annual operating expenses.
Depreciation and Income Taxes: These are either non-cash expenses (depreciation) or are specific to the owner's tax situation, not the property's performance. They don't belong in the NOI calculation.
By carefully tallying up your income and subtracting only the true operating expenses, you'll arrive at an NOI you can stand behind. For a deeper dive into this crucial metric, check out our guide on how to find net operating income. This number is the bedrock of any solid real estate analysis.
Putting the Cap Rate Formula to Work: A Practical Example
Theory is great, but putting it into practice is where the real learning happens. To get a feel for the formula for cap rate in real estate, let's ditch the definitions and jump into a real-world scenario. This is exactly how institutional investors start to size up a deal, turning raw numbers into a metric that actually means something.
We’ll walk through the numbers for a hypothetical 50-unit apartment building, building its cap rate from the ground up so you can see every moving part.
Deal Lens Example: A 50-Unit Multifamily Property
First things first, we need to nail down the Net Operating Income (NOI). The key here is precision—we only want to include true operational income and expenses, nothing else.
Let's assume our property has the following financials:
Gross Potential Rent (GPR): 50 units x $1,500/month x 12 months = $900,000
Less Vacancy (5%): We need a realistic buffer for empty units and turnover = -$45,000
Effective Gross Income (EGI): This is what we can realistically expect to collect = $855,000
Less Operating Expenses (40% of EGI): This bucket covers everything from property management and taxes to insurance and maintenance = -$342,000
After all that, we’re left with a clean Net Operating Income (NOI) of $513,000.
Now, let's say this property has a current market value of $8,550,000. We officially have the two ingredients we need.
Plugging these into our formula:
Cap Rate = $513,000 (NOI) / $8,550,000 (Value)
That gives us a cap rate of 6.0%.
Novice Lens: So what does a 6.0% cap rate really mean in plain English? Think of it this way: for every dollar you invest in the property's value, you can expect to get 6 cents back in net income each year. This is before you even think about mortgage payments. It’s a pure, simple measure of the property's earning power on its own.
Let’s look at a different scenario to see how cap rates can signal an opportunity. Imagine a building in Manhattan with an NOI of $336,000 valued at just $3 million. That would be an 11.2% cap rate. Compared to a market that averages around 6%, that high number screams that there might be a value-add play here—an opportunity to make improvements and stabilize the asset for a bigger payoff. You can discover more insights about real estate cap rates on concreit.com.
Advanced Lens: For a seasoned investor, that 6.0% is just the "going-in" cap rate—the starting line. The real analysis kicks in when you start modeling how you can push that NOI higher through smart operational tweaks or rent growth. You’re also forecasting the "exit" cap rate for when you eventually sell. That spread between your going-in and exit cap rate is where the real profit is made in value-add real estate.
What a Cap Rate Really Tells You
Once you get the hang of the formula for cap rate in real estate, you can start to see beyond the numbers and really understand the story they’re telling. A cap rate isn’t just some dry output from a calculator; it's a living, breathing signal from the market. It’s a snapshot that tells you everything about the risk, growth potential, and overall investor feeling for a specific property in a specific place.
At its core, the cap rate has a simple, seesaw-like relationship with property value. When one goes up, the other goes down. A low cap rate doesn't automatically signal a bad deal—in fact, it often means just the opposite.
A low cap rate is usually a sign of a high-value, lower-risk asset in a great location. Investors are willing to pay a premium for stability and safety, driving up the property's value and, in turn, pushing the cap rate down. Think of a brand-new Class A apartment building in a hot market like Miami or Austin.
Interpreting Cap Rates Across Markets and Asset Classes
So, what’s a "good" cap rate? The honest answer is: it depends. A 6% cap rate might be a home run for a stable industrial warehouse, but it could be a red flag for a much riskier hotel development project. Context is everything. You have to compare apples to apples, looking at the property type, its class (A, B, or C), and where it’s located.
You can start to get a feel for the landscape by looking at the typical ranges:
Class A Properties (Gateway Cities): These are the trophy assets in prime locations. They have the lowest cap rates because they're seen as the safest bets, with high-credit tenants and strong appreciation potential.
Class B Properties (Value-Add): You'll find these in good, but not necessarily A-list, locations. They offer a great balance, with moderate cap rates that reflect solid income today and real upside potential through smart renovations or better management.
Class C Properties (Opportunistic): These properties come with the highest cap rates. They're often older, in less desirable areas, and might need a serious capital injection. The risk is higher, but so is the potential reward if you can execute your business plan.
To help you benchmark opportunities, here’s a look at how these ranges typically break down.
Illustrative Cap Rate Ranges by Property Type and Class
This table gives you a general idea of what to expect when you're looking at deals across different sectors. Keep in mind, these are just illustrative—local market conditions can and will cause these numbers to shift.
Property Type | Class A (Prime) | Class B (Value-Add) | Class C (Opportunistic) |
|---|---|---|---|
Multifamily | 4.0% - 5.5% | 5.5% - 6.5% | 6.5% - 8.0%+ |
Industrial | 4.5% - 6.0% | 6.0% - 7.5% | 7.5% - 9.0%+ |
Office | 5.5% - 7.0% | 7.0% - 8.5% | 8.5% - 10.0%+ |
Retail | 5.0% - 6.5% | 6.5% - 8.0% | 8.0% - 9.5%+ |
Looking at a chart like this, it’s clear that risk and return are two sides of the same coin. The lower, tighter ranges for Class A properties reflect their perceived safety, while the higher, wider ranges for Class C assets show the greater risk—and greater potential upside—investors are taking on.
A Global Perspective on Market Signals
The cap rate formula is used everywhere, but the results can be wildly different from one city to another, reflecting local economies, risk appetites, and growth forecasts.
For instance, a broad analysis of $2 trillion in global transactions revealed that while prime commercial properties might trade in a 4.5-6.5% cap rate range, riskier assets in less stable markets can demand anywhere from 8-12%. This difference is crystal clear when you compare a multifamily property in New York trading at a 4.1% cap rate to one in Mumbai at 7.8%—a gap driven entirely by different local growth and vacancy dynamics.
Ultimately, a cap rate is just one piece of the puzzle. To really understand what you're looking at, you have to place it within the context of a full real estate investment analysis. As you start digging into deals, you can learn more about what a cap rate means for investors in our detailed guide.
Thinking Beyond the Initial Cap Rate
For sophisticated investors, calculating a property’s initial cap rate is just the first step. Think of it as a snapshot in time—a valuable look at the asset the moment you acquire it. But the real art of value creation is understanding how this metric will evolve over the entire life of the investment.
The initial formula is static, but private equity underwriting is anything but. This is where institutional investors focus their energy: not on the cap rate of today, but on the cap rates of tomorrow. The real money is made in the spread between the rate you buy at and the rate you sell at.
The Three Core Cap Rates in Underwriting
In any value-add or opportunistic deal, the goal is to actively bend the components of the cap rate formula in your favor. This requires a crystal-clear view of three distinct milestones in your investment journey:
Going-in Cap Rate: This is your starting line. It’s the cap rate at the time of purchase, calculated using the property's current NOI and your acquisition price.
Stabilized Cap Rate: This is your target, often called the "pro-forma" cap rate. It’s the projected cap rate after your business plan is complete—renovations are done, new tenants are in, and the NOI has been pushed higher.
Exit Cap Rate: This is your forecast for the cap rate when you eventually sell the property. It's a critical assumption that hinges on where you think the market will be years down the road.
The heart of a successful value-add strategy is creating a positive "spread" between your going-in and exit cap rates. You buy at a higher cap rate (a lower price relative to income) and sell at a lower one (a higher price) after you've forced appreciation by boosting the NOI.
How Cap Rate Spreads Drive Profit
Creating this spread isn't a passive exercise; it’s an active process of manufacturing value. A simple example from PNC shows just how powerful this can be: imagine a property with an $80,000 NOI that you purchase for $1 million. That’s an 8% going-in cap rate.
Now, let's say your strategic improvements and a healthy market allow you to sell when the market cap rate for similar assets is 6%. That shift alone—known as cap rate compression—pushes the property's value to $1.33 million. That’s a 33% increase in value, driven purely by the change in the cap rate. You can read the full analysis of cap rates on wallstreetprep.com.
This dynamic approach is what separates passive asset ownership from active value creation. It requires a forward-looking mindset that integrates market forecasts and operational expertise into a comprehensive financial model. To see how these projections fit into a larger valuation framework, you can learn how to calculate a discounted cash flow for real estate success in our detailed guide.
Common Cap Rate Mistakes to Avoid
The formula for cap rate in real estate is an exceptional tool for a first-pass analysis, but leaning on it too heavily is a rookie mistake. It’s nothing more than a static, one-year snapshot of a property's performance. That single number can be seriously misleading if you don't look at it with a critical eye.
A cap rate, on its own, tells you absolutely nothing about future rent growth, the impact of debt, or the time value of money.

Treating the cap rate as the final word instead of the first question is one of the fastest ways to misjudge a deal. To protect your capital, you have to dig deeper and look well beyond that surface-level number.
Investor Checklist: Questions to Ask About a Cap Rate
When a sponsor pitches a deal, the cap rate is almost always the headline number. Your job is to take it apart. Use these questions as a starting point to pressure-test the assumptions baked into that calculation.
Is the NOI based on trailing financials or pro-forma? Always underwrite based on actual, in-place performance first before considering future projections.
What capital expenditures (CapEx) are looming? A high cap rate can sometimes hide significant deferred maintenance. Does the financial model adequately reserve for a new roof, HVAC, or other major upcoming costs?
How was the market cap rate determined? Is it based on genuinely comparable properties (same asset class, quality, location, and tenant profile)?
What are the underlying rent growth assumptions? Are they supported by third-party market data, or are they overly optimistic?
What is the assumed exit cap rate? Is the sponsor underwriting a lower (more aggressive) exit cap rate than the purchase cap rate? Why? What market shifts support this assumption?
How does this cap rate compare to the 10-year Treasury yield? The "spread" between these two numbers is a key indicator of real estate risk premium. Is that spread widening or narrowing?
A cap rate is a valuable starting point, but it's not the finish line. It tells you about the now, but a successful investment is built on a clear understanding of the next. This is why sophisticated analysis always moves from the cap rate to a full discounted cash flow (DCF) model and Internal Rate of Return (IRR) calculation for a complete picture.
Key Risks & Mitigations
Risk: Interest Rate Volatility. Rising rates can increase borrowing costs and expand market cap rates, potentially lowering property values at exit.
Mitigation: Employ conservative leverage, use fixed-rate debt where possible, and underwrite multiple exit scenarios with higher cap rates to stress-test returns.
Risk: Inaccurate NOI Calculation. Overly optimistic income projections or underestimated expenses can make a deal appear more profitable than it is.
Mitigation: Insist on reviewing trailing 12-month (T-12) financials, conduct thorough expense audits, and use credible third-party data for market rent and vacancy assumptions.
Frequently Asked Questions About the Cap Rate Formula
Even once you get the mechanics down, real-world questions always pop up. Let's tackle a few of the most common ones we hear from investors, from those just starting out to sophisticated family offices.
What Is a Good Cap Rate?
This is the million-dollar question, and the honest answer is: it depends. There’s no magic number that works everywhere. A "good" cap rate is all about context—the asset, the market, and your strategy.
For instance, a 4.5% cap rate might be a fantastic deal for a brand-new, fully leased apartment building in a booming city center. Here, you're paying a premium for stability and low risk.
On the other hand, you might need an 8.0% cap rate to even consider an older, half-empty office building in a secondary market. That higher number is your compensation for taking on the risk and heavy lifting of a turnaround project. A good cap rate is simply one that pays you fairly for the risk you're taking.
How Do Interest Rates Affect Cap Rates?
Think of them as dance partners—they generally move in the same direction. When the Federal Reserve hikes interest rates, the cost of borrowing money goes up for everyone, including real estate investors.
To make their deals work and hit their target returns, investors now need one of two things: higher income from the property or a lower purchase price. This puts downward pressure on what buyers are willing to pay, which in turn pushes cap rates higher across the market.
In short, as the cost of capital goes up, investors demand a higher initial yield to make a deal pencil out. This market-wide adjustment is often called "cap rate expansion."
Can a Cap Rate Be Negative?
Yes, but it's incredibly rare and signals a very specific situation. A negative cap rate means a property's operating expenses are higher than its income, creating a negative Net Operating Income (NOI).
You'll usually only see this in a few scenarios. It could be a deeply distressed asset that's bleeding cash and needs a complete overhaul. More commonly, you might see it with vacant land or empty buildings. In those cases, investors aren't buying for current cash flow; they're betting entirely on future appreciation or development potential.
At Stiltsville Capital, we go beyond simple formulas to underwrite opportunities with institutional discipline. Well-structured real assets can be a prudent, resilient component of a long-term wealth strategy, and our focus is on creating value through diligent operations and clear alignment of interests.
If you're an accredited investor looking for access to high-potential commercial real estate in growing Sunbelt markets, we invite you to schedule a confidential call. Discover how our expertise can help you achieve your long-term wealth strategy goals.
Information presented is for educational purposes only and does not constitute an offer to sell or a solicitation of an offer to buy securities. Any offering is made only through definitive offering documents (e.g., private placement memorandum, subscription agreement) and is available solely to investors who meet applicable suitability standards, including “Accredited Investor” status under Rule 501 of Regulation D. Investments in private real estate involve risk, including loss of capital, illiquidity, and no guarantee of distributions. Past performance is not indicative of future results.