Capitalization Rate for Rental Property: An Investor's Complete Guide
- Ryan McDowell

- Sep 13, 2025
- 11 min read
Reading Time: 8 min | Good for Investor Personas: A, B
TL;DR: Key Takeaways for Investors
What it is: The capitalization rate, or "cap rate," is a simple metric showing a property's potential annual return before considering any financing. It's calculated as Net Operating Income (NOI) divided by the property's current value.
Why it matters: It's the universal first-pass test for quickly comparing different investment opportunities on an apples-to-apples basis, revealing a property's raw operational profitability.
What's a "good" cap rate?: There's no single answer. A lower cap rate (e.g., 4-5%) typically signals lower risk and a high-quality, stable asset. A higher cap rate (e.g., 7-8%+) suggests higher potential returns but comes with increased risk, often in value-add or opportunistic plays.
What it's not: Cap rate is a snapshot, not the full story. It ignores the powerful return-amplifying effects of leverage (debt) and doesn't account for total returns over time. For that, you need metrics like IRR and Cash-on-Cash Return.
Why Cap Rate Is the First Metric Every Real Estate Investor Masters
Before anyone pulls out a complex financial model, the first number seasoned investors and newcomers alike look at is the capitalization rate for rental property. It’s the essential first-pass test of a property's financial health, giving you a clean, apples-to-apples way to line up different investment opportunities.
It doesn’t matter if you're sifting through a portfolio of apartment buildings or just eyeing a single retail strip. The cap rate is your starting point. It answers one simple question: how hard is my money working for me, based on this property's income alone?
By cutting through the noise of financing and taxes, the cap rate reveals a property's true operational profitability. This makes it a go-to tool for a few key reasons:
Quickly screening deals: You can efficiently weed through dozens of potential investments to find the handful that actually meet your baseline return goals.
Benchmarking opportunities: It allows you to directly compare your target property against similar ones that have recently sold in the same market.
Gauging market sentiment: Watching cap rates move up or down gives you a real-time pulse on investor demand and the overall health of the market.
Breaking Down the Cap Rate Formula
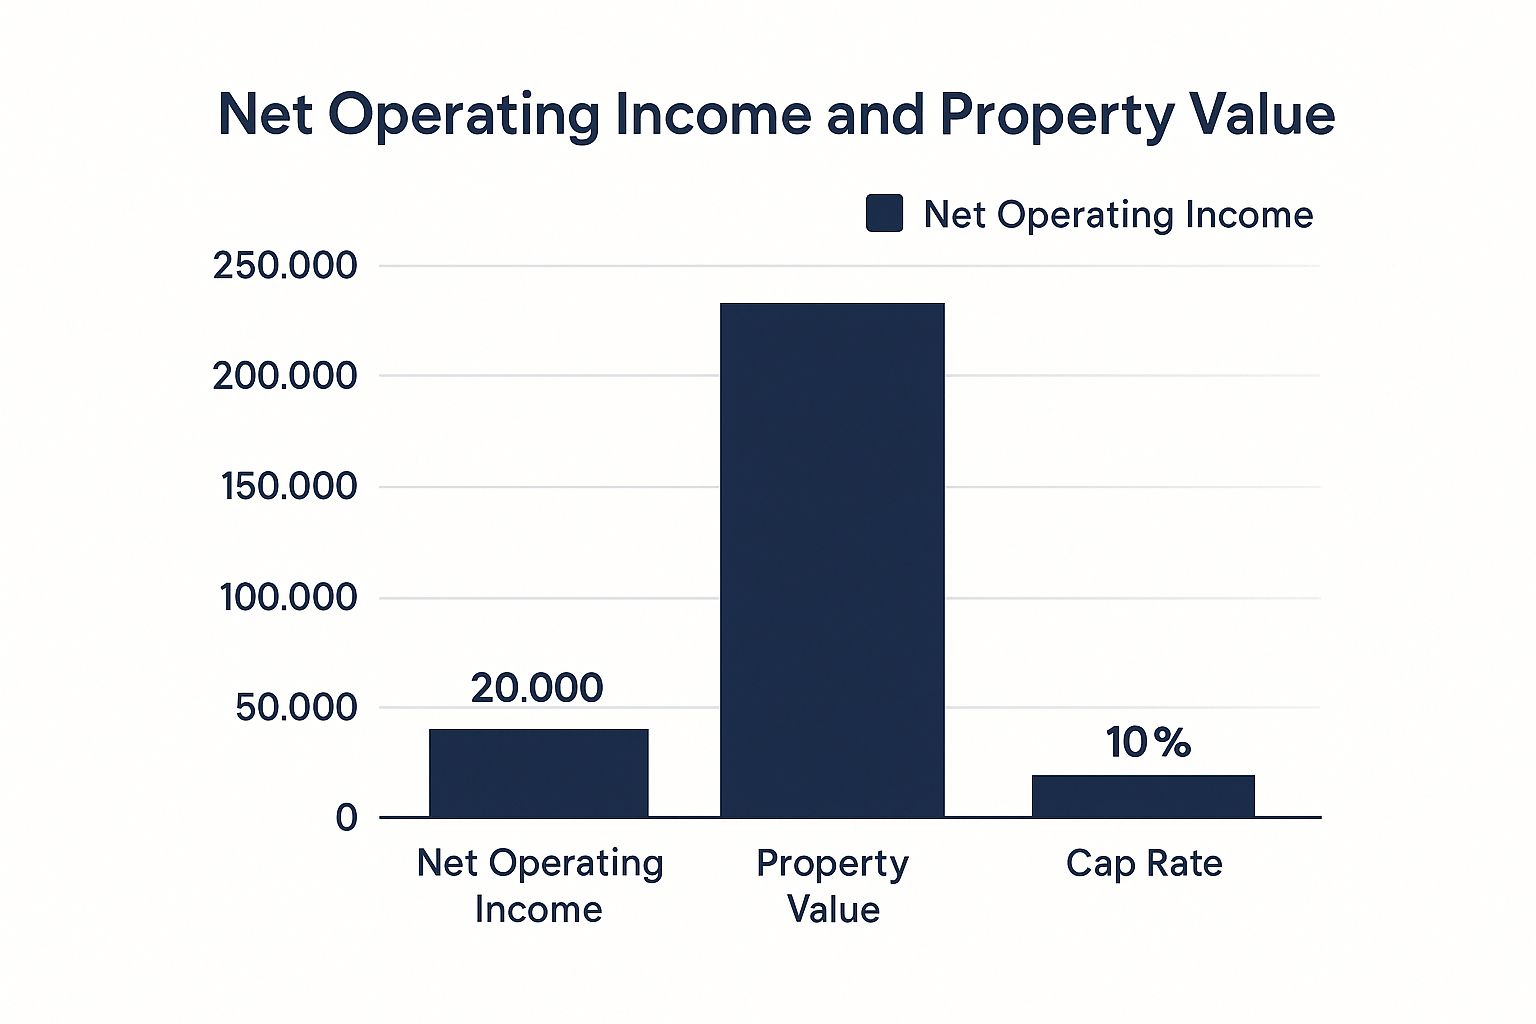
The math itself is refreshingly simple. It all boils down to two key numbers: the Net Operating Income (NOI) and what the property is worth today.
The Formula: Capitalization Rate = Net Operating Income (NOI) / Property Value
### Why It Matters for Novice InvestorsThink of cap rate as a property's "unleveraged yield." A 5% cap rate means the building generates income equal to 5% of its price tag each year, before you pay a mortgage. It's the purest measure of the asset's own earning power, making it perfect for comparing deals fairly.
Getting a handle on these two inputs is the first real step to using this metric like a pro. While the formula is simple, the quality of your analysis depends entirely on the accuracy of these numbers. A fuzzy NOI or an unrealistic property value will give you a meaningless result.
Cap Rate Formula Components at a Glance
Component | What It Represents | Why It's Important |
|---|---|---|
Net Operating Income (NOI) | The property's total annual income (rent, fees) minus all its operating expenses (taxes, insurance, maintenance). | It shows the property's raw ability to generate cash from its day-to-day operations, completely separate from the owner's loan or tax situation. |
Property Value | The current market price or the price you’ve agreed to pay for the asset. | This is the denominator in the equation; it’s the total capital you need to invest to get access to that stream of income (the NOI). |
How to Calculate Cap Rate with Confidence
Okay, let's move from theory to reality. Getting an accurate capitalization rate for a rental property isn’t just about plugging numbers into a formula. It's about making sure those numbers are rock-solid.
The entire calculation balances on two key inputs: the Net Operating Income (NOI) and the property’s value. Nail these, and you’ll have a reliable projection. Get them wrong, and you're just guessing.
Step 1: Nailing Down the Net Operating Income
Think of Net Operating Income (NOI) as the true financial pulse of a property. It's the total cash it generates after you've paid all the essential bills to keep it running—but before you've paid the mortgage or income taxes. This is where many investors trip up. You have to be meticulous here.
Start with Income:
Gross Potential Rent: The maximum rent you could collect if every unit was occupied 100% of the time.
Vacancy Loss: Subtract a reasonable amount for empty units. A 5% vacancy factor is a common, conservative starting point.
Other Income: Revenue from laundry machines, paid parking, pet fees, etc.
Subtract Operating Expenses:
Property Taxes & Property Insurance
Utilities not paid by tenants
Repairs & Maintenance
Property Management Fees (even if self-managing, include a market-rate fee)
Crucial Distinction: Mortgage payments, major capital improvements (like a new roof), and depreciation are never included in the NOI calculation. Those items relate to your financing and tax strategy, not the building's core operational health.
If you want to go deeper, we have a full guide on how to find Net Operating Income for real estate investors.
Step 2: Establishing the Property's Value
This part is usually more straightforward. If you're buying, the value is the asking price or what you plan to offer. If you already own the building, its value is what it would sell for today, determined by an appraisal or recent comparable sales ("comps").
Deal Lens: A Small Multifamily Property Example
Let's walk through an illustrative scenario to see the capitalization rate for a rental property in action. Imagine we're analyzing a small apartment building.
Property Details:
Purchase Price: $2,000,000 (Illustrative)
Number of Units: 10
Annual Gross Potential Rent: $240,000
Now, let's calculate the NOI:
Gross Potential Rent: $240,000
Less Vacancy (5%): -$12,000
Effective Gross Income: $228,000
Less Operating Expenses (assumed 35%): -$79,800
Net Operating Income (NOI): $148,200
With the NOI, we can now calculate the cap rate:
Cap Rate = NOI / Property ValueCap Rate = $148,200 / $2,000,000 = 0.0741
So, our cap rate is 7.41%. This number gives us a clean metric to compare this deal against other opportunities.
### Advanced Lens: Common Calculation Traps for Sophisticated Investors* Trusting "Pro-Forma" Numbers: A seller's marketing flyer will show best-case-scenario projections. Always demand the trailing 12-24 months of actual operating statements (the "T-12"). Base your math on what the property has done, not what the seller hopes it will do.* Forgetting Tax Reassessment: When a property sells, the county often reassesses its value based on the new, higher sale price. Many investors forget to adjust the property tax expense upward. This single mistake can wreck your NOI and make a deal look far more profitable than it actually is.
What Is a Good Cap Rate for Rental Property?
The honest answer isn't a single number. Think of it less as a grade and more as a reflection of the market’s view on the risk and potential return for a specific property, in a specific location, right now.
A low cap rate isn't automatically a bad deal, just as a high cap rate isn't always a home run. A low rate often signals stability and high demand—the real estate equivalent of a government bond. A high rate suggests bigger potential returns but usually comes with more risk, like a property in an unproven area or one that needs significant work. The "right" cap rate is all about your strategy.
Key Factors That Influence Cap Rates
A property's cap rate is shaped by dynamic factors that signal its perceived risk and future potential. Understanding these drivers is crucial.
Property Type: A multifamily building with diverse tenants is generally seen as less risky than a single-tenant retail space and will often trade at a lower cap rate.
Market Tier: A property in a "gateway" market like Miami will command a lower cap rate than a similar building in a smaller town due to higher investor demand and perceived economic stability.
Asset Class (A, B, or C): Class A properties (new, high-end) have the lowest cap rates. Class C properties are typically older and need more hands-on management, justifying a higher cap rate to compensate for the extra risk.
The Broader Economy and Benchmarks
Beyond the property itself, the bigger economic picture plays a massive role. Interest rates, inflation, and economic growth directly impact investor sentiment and, in turn, cap rates. For historical context, CBRE's research offers some great insights on long-term trends.
### Market Signal Box: Cap Rate Expansion (as of Q2 2024)* The Signal: The Federal Reserve's rate hikes over the past two years have increased the cost of borrowing for real estate.* The Interpretation: With higher debt costs, investors now require higher initial yields (cap rates) to achieve their target returns. This has put upward pressure on cap rates across most property types.* Investor Take: This is known as cap rate expansion. In this environment, property values face headwinds unless Net Operating Income (NOI) grows fast enough to offset higher cap rates. It's a critical dynamic to watch in today's market.
Illustrative Cap Rate Ranges by Property Type and Market Tier
This table shows typical capitalization rate ranges for various commercial rental properties. Data as of Q2 2024, for illustrative purposes. Source: Stiltsville Capital internal analysis, market reports.
Property Type | Class A (Core Markets) | Class B (Secondary Markets) | Class C (Tertiary/Value-Add) |
|---|---|---|---|
Multifamily | 4.0% - 5.25% | 5.0% - 6.0% | 6.0% - 7.5%+ |
Industrial / Logistics | 3.75% - 5.0% | 4.75% - 5.75% | 5.5% - 7.0%+ |
Neighborhood Retail | 5.5% - 6.5% | 6.25% - 7.25% | 7.0% - 8.5%+ |
Medical Office | 5.0% - 6.0% | 5.75% - 6.75% | 6.5% - 8.0%+ |
Understanding the Impact of Cap Rate on Property Value
The capitalization rate for a rental property and its value have an inverse relationship, like two ends of a seesaw. When cap rates go down (compression), property values go up. When cap rates climb (expansion), values fall—even if the property’s income hasn’t changed.
This is driven by investor demand and the cost of capital. In a hot market with low interest rates, more investors chase deals, bidding up prices and pushing cap rates down. When interest rates rise, investors demand higher returns, offering lower prices for the same income stream and forcing cap rates up.
The Math Behind the Movement
We can flip the cap rate formula to solve for value:
Property Value = Net Operating Income (NOI) / Capitalization Rate
Let's use a simple example. A property generates a steady $100,000 in NOI annually.
At a market cap rate of 6%, its value is $100,000 / 0.06 = $1,666,667
If the market heats up and the cap rate compresses to 5%, the value jumps to $100,000 / 0.05 = $2,000,000
If the market cools and the cap rate expands to 7%, the value drops to $100,000 / 0.07 = $1,428,571
A one-point swing in the cap rate created a value change of over $570,000, without the property's performance changing at all. This highlights the importance of market timing. You can explore more insights on these historical rate relationships for a deeper dive.
Deal Lens: How Value-Add and Cap Rate Compression Create Returns
Sophisticated investors use this to their advantage. They combine operational improvements with smart market timing to generate powerful returns. This is the heart of many value-add real estate strategies.
The Scenario: Stiltsville Capital buys an underperforming apartment building.
The Acquisition (Illustrative):
Purchase Price: $10,000,000
Current NOI: $600,000
Entry Cap Rate: 6.0% ($600,000 / $10,000,000)
The Value-Add Plan (Years 1-3):
Boost the NOI: We invest in strategic renovations and bring in better management, allowing us to raise rents to market levels.
The Result: The NOI climbs from $600,000 to $725,000.
The Exit (Year 5):
During our hold, the submarket has improved, causing cap rates for similar buildings to compress slightly.
New, Stabilized NOI: $725,000
Exit Cap Rate: 5.5%
The Sale Price Calculation:
New Value = $725,000 / 0.055 = $13,181,818
The property's value increased by nearly $3.2 million. That profit came from two sources working in tandem: the $125,000 NOI increase we created, and the favorable market tailwind that pushed our exit cap rate down. Understanding this dual-engine approach is crucial.
Why Cap Rate Is Not the Only Metric That Matters
While the capitalization rate for a rental property is a fantastic starting point, relying on it alone is like judging an album by its first track. It misses the rest of the story. A cap rate is simple because it ignores three powerful forces that drive investor returns: financing, time, and future growth.
A cap rate analyzes a property as if you bought it with cash. But in the real world, most commercial real estate is purchased with debt. This leverage can massively amplify the returns on the actual cash you put into a deal. Since the cap rate ignores mortgage payments, it can't tell you your real cash-on-cash return.
Furthermore, a cap rate is a one-year snapshot. It doesn't account for the total profit you'll make over the entire life of the investment, including the final sale. For that, you need more dynamic tools.
Key Real Estate Investment Metrics Compared
Metric | What It Measures | Best Use Case | Considers Financing? |
|---|---|---|---|
Capitalization Rate | The property's unleveraged annual return. | Quick, apples-to-apples comparison of properties. | No |
Cash-on-Cash Return | Annual pre-tax cash flow relative to total cash invested. | Understanding your actual cash yield in a single year after debt. | Yes |
Internal Rate of Return (IRR) | Annualized rate of return over the entire investment lifecycle. | Evaluating total, time-weighted profitability from start to finish. | Yes |
Equity Multiple | Total cash received divided by total cash invested. | Seeing the total cash profit multiple on your investment, regardless of time. | Yes |
Each metric offers a vital perspective. For instance, the Cash-on-Cash Return is critical for investors focused on immediate income. Learn more in our complete guide to Cash-on-Cash Return. A comprehensive analysis uses all these tools in concert.
Applying Cap Rate Analysis in Today’s Market
Putting these concepts together is how you navigate the current real estate market. The capitalization rate for rental property is a living signal that reflects market sentiment, economic policy, and investor confidence.
For example, between 2021 and early 2024, we saw U.S. apartment cap rates expand from an average of 4.1% to about 5.2%. This 110-basis-point jump, as detailed in Callan's multifamily market analysis, happened as the Federal Reserve aggressively hiked interest rates, forcing a market recalibration. This volatility highlights why thorough due diligence is non-negotiable.
Investor Checklist: Questions to Ask a Sponsor
Before committing capital, you need to probe a sponsor's cap rate assumptions. A good sponsor will welcome these questions.
Entry Cap Rate: Can you provide the recent comparable sales that justify your going-in cap rate?
NOI Projections: How do your projections for rent growth and expenses compare to the submarket's actual performance over the last 3 years?
Exit Cap Rate: What is your projected exit cap rate, and why is it conservative relative to the entry cap rate?
Sensitivity Analysis: How does a 50 or 100-basis-point increase in the exit cap rate affect the projected IRR and Equity Multiple? You can read more about how lower interest rates can act as a catalyst for commercial real estate.
Reversionary Value: If you’re projecting cap rate compression (a lower exit cap vs. entry cap), what is the specific market or operational justification for that assumption?
Take the Next Step
Understanding the fundamentals of cap rate analysis is the first step toward building a resilient real estate portfolio. Well-structured real assets, underwritten with discipline, can be a prudent and powerful component of a long-term wealth strategy.
If you are an accredited investor interested in exploring passive institutional-quality real estate opportunities, we invite you to connect with our team.
Schedule a confidential call with Stiltsville Capital to discuss how our disciplined approach can align with your investment goals.
Information presented is for educational purposes only and does not constitute an offer to sell or a solicitation of an offer to buy securities. Any offering is made only through definitive offering documents (e.g., private placement memorandum, subscription agreement) and is available solely to investors who meet applicable suitability standards, including “Accredited Investor” status under Rule 501 of Regulation D. Investments in private real estate involve risk, including loss of capital, illiquidity, and no guarantee of distributions. Past performance is not indicative of future results.
Comments