What Is Cash on Cash Return? A Clear Guide for Real Estate Investors
- Ryan McDowell

- Aug 22, 2025
- 16 min read
Reading Time: 8 min | Good for: Novice Investors (A), Informed Principals (B)
TL;DR: Your Quick Takeaway
What It Is: Cash on cash return is a simple metric that measures the annual pre-tax cash flow an investment generates relative to the total cash you invested.
Why It Matters: It answers the core question: "For every dollar I put in, how many cents am I getting back in my pocket this year?" This makes it excellent for comparing the income potential of different deals.
What It Misses: It's a snapshot, not the whole movie. It ignores long-term value drivers like property appreciation, loan paydown (equity buildup), and powerful tax benefits like depreciation.
The Bottom Line: A vital first-look metric for income-focused investors, but it must be used alongside other metrics like IRR and Cap Rate for a complete picture.
In the world of real estate investing, you need a way to quickly gauge how hard your money is actually working. That's where cash on cash return comes in. It’s a simple yet powerful metric that tells you the annual pre-tax cash flow you'll get back, relative to the total cash you put into the deal.
Think of it this way: it cuts through the noise of complex financial models and shows you the raw, income-generating power of an investment in its first year.
Why Cash on Cash Return Matters to Investors

If your goal is to build steady, predictable income streams from your real estate portfolio, cash on cash return is one of the first numbers you should look at. It's essentially the real estate equivalent of a stock's dividend yield. It answers the one question every investor has: "For every dollar I put in, how many cents am I getting back in my pocket this year?"
This clarity makes it a fantastic tool for comparing different opportunities. You can line up several potential deals—a multifamily building, a medical office, a small warehouse—and see them on an apples-to-apples basis. A property with a projected 8% cash on cash return is instantly more compelling from an income perspective than one offering just 4%. It helps you quickly sort through deals to find what truly aligns with your financial goals.
A Focus on Annual Performance
Unlike metrics that factor in long-term appreciation or tax benefits, cash on cash return is all about the here and now—the tangible cash flow hitting your account. This sharp focus makes it especially valuable for a few key scenarios:
Income-focused investors: Perfect for anyone who needs their portfolio to produce predictable, regular income to supplement other sources.
Evaluating leveraged deals: It brilliantly highlights how using financing (a loan) can amplify the returns on your out-of-pocket cash.
Initial screening: It acts as a quick, effective filter to weed out underperforming assets before you waste time on deeper analysis.
Historically, private real estate has been a strong performer. A comprehensive study by Jordà, Knoll, Kuvshinov, Schularick, and Taylor (as of 2019) covering 1870 to 2015 found that the global average real return on housing was around 7.05%, which edged out equities (6.89%) over that same stretch. The first step to achieving returns like that is knowing how to calculate a deal's annual cash flow. You can learn more about what this metric means for real estate investors in our guide.
Insight Edge: It's tempting to think higher is always better, but context is everything. A higher cash on cash return often signals higher risk. A brand-new, fully-leased building in a top-tier location (a "Core" asset) might deliver a stable but lower return. Meanwhile, a value-add project that needs a major overhaul should promise a much higher return to compensate you for the extra work and execution risk.
How to Calculate Cash on Cash Return
You can talk about the theory behind cash on cash return all day, but true confidence comes from building the calculation yourself, piece by piece. The formula itself is simple, but its real power is in knowing exactly what goes into it. This step-by-step approach removes the guesswork.
The basic formula is:
Cash on Cash Return = (Annual Pre-Tax Cash Flow / Total Cash Invested) x 100
To get a number you can actually trust, we need to break down both parts of this equation: the cash the property generates and the total cash you had to put into the deal. Let's walk through it.
This visual helps show how all the financial pieces fit together.
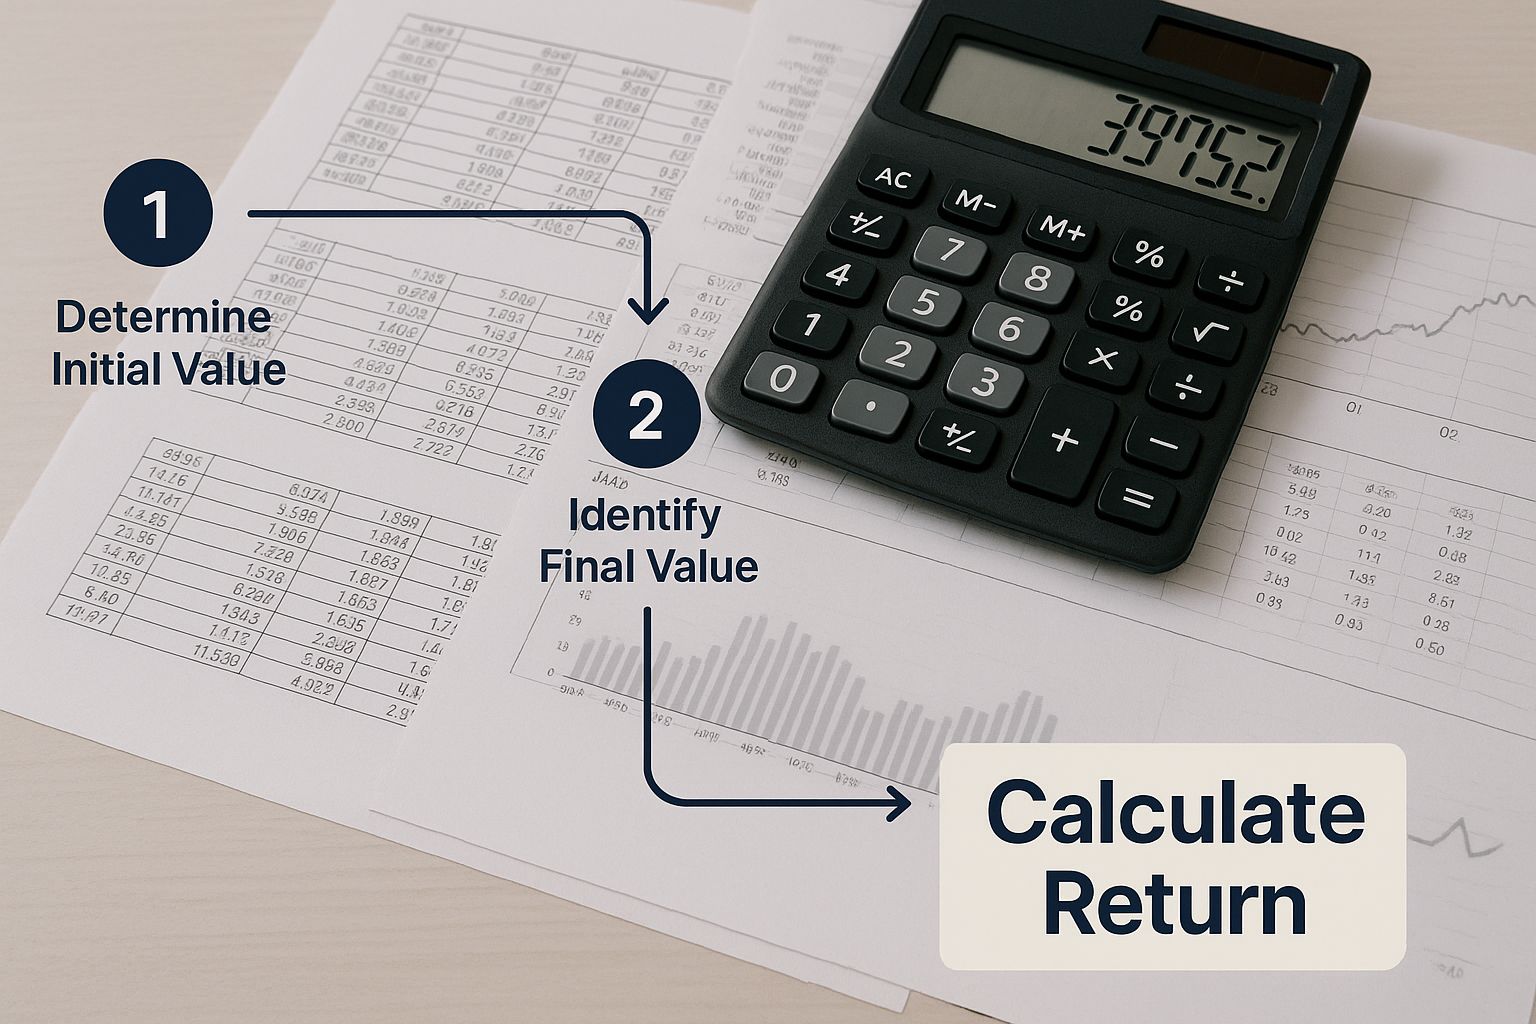
As you can see, the process is all about tallying up your income, subtracting all the real costs, and then dividing that final cash flow number by your initial out-of-pocket investment.
Step 1: Determine Annual Pre-Tax Cash Flow
This is the number that matters most to many investors—it’s the actual cash left over at the end of the year, before you pay income taxes. It's the money you can put in your pocket, reinvest, or use for anything else.
Novice Lens: A common point of confusion is mixing this up with Net Operating Income (NOI). To find your annual pre-tax cash flow, you have to account for everything, including your loan payments. Cash Flow is what's left for you, while NOI is what's left for both you and the bank.
Here’s how to calculate it:
Start with Gross Scheduled Income (GSI): This is your best-case scenario—the total potential rent you could collect if the property were 100% occupied all year.
Subtract Vacancy and Credit Loss: Let's be realistic. No property stays full forever. You need to subtract an allowance for empty units or tenants who don't pay. A safe bet is usually between 5-10% of GSI, depending on your market. This gives you the Effective Gross Income (EGI).
Subtract All Operating Expenses: This bucket includes every single cash cost needed to keep the property running. Don't include "paper" expenses like depreciation here. Think real money out the door for things like property taxes, insurance, utilities, maintenance, and property management fees.
Subtract Annual Debt Service: This is the critical step that separates pre-tax cash flow from NOI. You must subtract the total mortgage payments (both principal and interest) you made for the year.
The number you're left with is your Annual Pre-Tax Cash Flow.
Step 2: Calculate Your Total Cash Invested
The second half of the formula is about getting an honest look at every dollar you put in to get the deal done. This isn't just your down payment; it's the full out-of-pocket cost to acquire the asset and get it running.
Your Total Cash Invested includes a few key pieces:
Down Payment: This is the big one—the initial equity you contribute to secure your loan.
Closing Costs: These are all the fees needed to finalize the deal. Think loan origination fees, appraisals, title insurance, and legal costs. These can easily add up to 2-5% of the purchase price.
Initial Renovation or Repair Costs: If you're buying a fixer-upper or a value-add property, this is a major component. It’s any capital you have to spend right away to improve the property and get it ready for tenants. This is your "rehab budget."
Add these all up, and you have your Total Cash Invested. This is the denominator in our equation, and using this complete number ensures your cash on cash return calculation reflects the true performance of your hard-earned capital.
A Practical Deal Example
Formulas are great, but nothing makes a concept click like a real-world example. Let's walk through a simplified deal for a value-add multifamily property—a popular strategy for investors chasing both rental income and property appreciation. By keeping the numbers clean and simple, we can see exactly how the cash on cash return is calculated and what it really tells us about an investment’s first-year performance.
Imagine we've found a 20-unit apartment building in a growing Sunbelt market. The property is underperforming, with dated units and rents below market rates. The business plan is straightforward: buy it, renovate units as tenants move out, and increase rents to market levels.
Step 1: Calculating Total Cash Invested
First, we need to figure out every single dollar that has to come out of our pocket to buy and stabilize this property. This is the "cash" in our "cash on cash" calculation, and it's more than just the down payment.
Purchase Price: $2,000,000
Loan Amount (75% Loan-to-Value): $1,500,000
Down Payment (25%): $500,000
But the down payment is just the entry ticket. We also have to cover the costs to close the deal and fund our renovation plan.
Closing Costs (3% of Purchase Price): $60,000
Initial Renovation Budget: $150,000
Tallying it all up gives us our true skin in the game.
Total Cash Invested = $500,000 (Down Payment) + $60,000 (Closing Costs) + $150,000 (Renovations) = $710,000
This $710,000 is the bottom number—the denominator—in our formula. It represents the total amount of our own capital at risk to get this project off the ground.
Deal Lens Example: Illustrative Multifamily Calculation
This table shows a simplified breakdown of the components used to calculate the Cash on Cash Return for our hypothetical value-add multifamily property.
Metric Component | Calculation/Item | Amount |
|---|---|---|
Purchase Price | Asking Price | $2,000,000 |
Loan Amount | 75% LTV | $1,500,000 |
Down Payment | 25% Equity | $500,000 |
Closing Costs | 3% of Purchase Price | $60,000 |
Renovation Budget | Initial Capital Expenditure | $150,000 |
Total Cash Invested | Down Payment + Closing + Reno | $710,000 |
Gross Potential Rent | 20 units x $1,250/mo x 12 | $300,000 |
Effective Gross Income | GPR - 5% Vacancy | $285,000 |
Net Operating Income (NOI) | EGI - OpEx ($115,000) | $170,000 |
Annual Debt Service | $1.5M loan @ 6.5% for 30yr | $113,772 |
Annual Pre-Tax Cash Flow | NOI - Debt Service | $56,228 |
Cash on Cash Return | (Cash Flow / Cash Invested) | 7.92% |
Seeing the numbers side-by-side makes it clear how we get from the purchase price to the final return metric. Each step builds on the last, giving us a complete financial picture.
Step 2: Projecting Annual Pre-Tax Cash Flow
Next, we need to forecast the property’s financial performance for the first year after our improvements. This means projecting the income and subtracting all the expenses to land on the net cash flow.
Let's say after renovations, we can get an average rent of $1,250 per month for each unit.
Gross Potential Rent (20 units x $1,250/mo x 12 mo): $300,000
Less Vacancy (5%): -$15,000
Effective Gross Income (EGI): $285,000
From that income, we have to subtract all the costs of running the building.
Total Operating Expenses (Taxes, Insurance, Mgmt, etc.): -$115,000
Net Operating Income (NOI): $170,000
Finally, we subtract our annual mortgage payments (our debt service) to find the pre-tax cash flow—the money that actually ends up in our pocket. With a $1.5M loan at 6.5% interest over 30 years, our annual payment is about $113,772.
Annual Pre-Tax Cash Flow = $170,000 (NOI) - $113,772 (Debt Service) = $56,228
Step 3: Revealing the Cash on Cash Return
We've got both pieces of the puzzle. Now we just plug them into the formula.
Cash on Cash Return = ($56,228 / $710,000) x 100 = 7.92%
For this deal, our projected first-year cash on cash return is 7.92%. That number gives us a clear, immediate benchmark to measure this deal's income potential against any other investment we might be considering.
Advanced Lens: Keep in mind, this 7.92% is just a snapshot of Year 1. Smart underwriting involves projecting how this return grows over time. If we assume a conservative 3% rent growth each year while expenses only grow by 2%, our cash flow will increase annually. By Year 3, the cash on cash return on our original $710,000 investment could climb to over 9.5%. This steady growth in cash flow is a key driver of the investment's total return over the long haul.
What Is a Good Cash on Cash Return?
So you've run the numbers and calculated your cash on cash return. The million-dollar question is… is it any good? Ask any seasoned investor, and you'll get the same honest answer: "It depends."
There’s no magic number here. A “good” return is a moving target, shifting with every deal’s unique risk profile, your overall strategy, and the current market climate.

Here's a simple framework: the return you demand should be directly tied to the risk you're taking on and the effort required. A brand new, fully stabilized apartment building with long-term leases in a top-tier location is a low-risk, low-effort investment. For a deal like that, you might accept a lower, more bond-like cash on cash return, perhaps in the 4% to 6% range.
Now, consider a value-add project—like the multifamily example we just walked through. It demands significant capital, hands-on management, and a rock-solid business plan. To make that extra risk and work worthwhile, you should be targeting a much higher return, often in the 8% to 12% ballpark, or even more for opportunistic plays.
Setting Your Return Benchmark
To figure out if a projected cash on cash return is "good" for you, you have to compare it against what your money could be doing elsewhere. This is where a big-picture view of the investment world becomes critical.
Historical data provides valuable context. One analysis of long-term returns found that U.S. stocks averaged about 9.9% annually since 1928, while bonds were around 4.6%. A deal's projected return has to be compelling enough to convince you to pull your capital away from these other options, especially when you factor in that private real estate is illiquid. You can explore more on these historical asset class returns to get a feel for the landscape.
The Power of Leverage
One of the most powerful aspects of real estate is using financing to amplify the returns on the cash you actually invest. This is where the cash on cash metric really flexes its muscles, because it focuses on the return on your actual out-of-pocket equity, not the property's total value.
Insight Edge: The Leverage AmplifierImagine buying a $1 million property. If you paid all cash and it generated $60,000 in annual pre-tax cash flow, your cash on cash return is a respectable 6% ($60,000 / $1,000,000).Now, let's bring in some leverage. You buy the same property but use a loan for 75% of the price. Your total cash invested is now just $250,000. After paying your annual debt service of, say, $40,000, your cash flow is now $20,000.Your new cash on cash return is 8% ($20,000 / $250,000). By using debt smartly, you've boosted the return on your equity by 33%. This amplification is a core reason why real estate can be such a potent wealth-building machine. To learn more, check out our guide to commercial real estate financing options.
Comparing Cash on Cash Return with Other Metrics
No single metric can ever tell you the full story of an investment. Smart investors use a dashboard of metrics to get a 360-degree view. Cash on cash return is a fantastic tool for measuring immediate income, but it has blind spots. Understanding how it stacks up against other key metrics is essential for making sharp, well-rounded decisions.
Here's a quick cheat sheet to clarify where each metric shines and what it misses.
Investment Metrics at a Glance
Metric | What It Measures | Best For Evaluating | Key Limitation |
|---|---|---|---|
Cash on Cash Return | Annual cash flow relative to your actual cash invested. | The efficiency of your equity in generating immediate income, especially in leveraged deals. | Ignores appreciation, loan paydown, and tax benefits; it's a single-year snapshot. |
Cap Rate | A property's unlevered annual income relative to its market value. | The relative value of similar properties in a market, independent of financing. | Ignores the powerful impact of financing (leverage) on your actual returns. |
Internal Rate of Return (IRR) | The total, time-weighted return over the entire life of an investment. | The long-term profitability of a deal, including appreciation and loan paydown. | It is a complex projection that is highly sensitive to future assumptions. |
At the end of the day, a "good" cash on cash return is one that properly rewards you for the specific risks of a deal while beating out your other investment alternatives. It’s a vital first-look metric, but it should always be used alongside other tools for a complete analysis.
Strengths and Weaknesses of This Metric
No single metric tells the whole story of a real estate investment. Ever. To make truly smart decisions, you have to understand not just what a number tells you, but what it’s leaving out. Cash on cash return is a fantastic tool for some jobs, but it has serious blind spots.
A balanced view reveals both its power and its limitations, turning you into a more discerning investor who can see beyond a single, flashy number.
The Strengths: Simplicity and Clarity
The biggest win for cash on cash return is how incredibly straightforward it is. It answers a simple, vital question: “For the cash I put in, how much cash am I getting back this year?” This clarity makes it incredibly useful for a few key things.
Focus on Immediate Income: It cuts right through complex projections about future appreciation or tax benefits and zeroes in on the annual cash flow your investment is producing. If your main goal is building a reliable income stream, this is your first and most important test.
Comparing Apples to Apples: Because it’s a simple percentage, it lets you quickly compare different types of deals. You can easily line up a multifamily property against a retail center and see which one gives you a better immediate cash yield on your money.
Highlighting Leverage: The metric brilliantly shows the power of using a loan. Since it’s based on your actual cash invested (not the property’s total value), it clearly demonstrates how financing can amplify the returns on your personal capital.
The Weaknesses: What Cash on Cash Return Misses
While its simplicity is a strength, it's also the source of its biggest weaknesses. This metric is a snapshot, not the full feature film. It intentionally ignores several key ways real estate builds long-term wealth.
Risk & Mitigation: Key Blind Spots * Blind Spot: It’s a Pre-Tax Metric. * Mitigation: The calculation completely ignores the impact of taxes. This means it doesn't account for powerful tax benefits like depreciation, which can seriously reduce your taxable income and boost your actual after-tax returns. Always model after-tax returns separately. * Blind Spot: It Overlooks Appreciation. * Mitigation: The metric is blind to any increase in the property's value over time. A deal with a modest 6% cash on cash return might actually be a home run if the property is appreciating by 10% a year. Use IRR to capture this total return. * Blind Spot: It Ignores Equity Buildup. * Mitigation: Every mortgage payment you make has a portion that pays down the loan principal. This is a form of forced savings that builds your equity, but cash on cash return doesn't capture it. Analyze the sources of return to see how much comes from amortization.
Myth vs. Reality: The High Return TrapMyth: The deal with the highest initial cash on cash return is always the best investment.Reality: Not necessarily. An investor might be looking at two deals: Deal A offers a 12% cash on cash return on a stabilized property in a slow-growth market. Deal B offers a 7% return on a value-add project in a rapidly appreciating neighborhood. While Deal A gives you more cash today, Deal B could generate far greater total wealth over five years through forced appreciation and loan paydown, leading to a much higher overall ROI. Relying only on the initial cash on cash return could cause you to miss the better long-term investment.
Ultimately, cash on cash return is an essential first-glance tool, but it should never be the only one you use. For a deeper dive into evaluating investment success, you can explore our guide on decoding asset management performance metrics.
Investor Checklist: Questions to Ask a Sponsor
Knowing the formula for cash on cash return is one thing. Putting that knowledge into action is what separates seasoned investors from the rest of the pack.
When a sponsor provides a pro forma, your job isn’t just to accept the numbers—it’s to pressure-test the assumptions behind them. This checklist is your toolkit for doing just that. These are the practical, institutional-grade questions that will help you perform sharper due diligence, spot potential red flags, and truly understand a deal's risks.
Questions for Underwriting Projections
A projected cash on cash return is only as good as the assumptions used to build it. A confident sponsor will have no problem walking you through their logic. Your job is to gently but firmly probe their projections.
Rent Growth: What annual rent growth are you projecting over the hold period? How does that compare to the submarket’s historical average? What are independent sources like CoStar or CBRE forecasting for this specific area?
Operating Expenses: How much do you expect expenses like property taxes, insurance, and management fees to increase each year (expense growth rate)? Are these projections based on the property’s actual history or just market averages?
Capital Expenditures: Does the budget include a capital reserve for future big-ticket items? How much per unit, per year, is earmarked for replacing things like a roof or HVAC systems? A low reserve can artificially inflate early cash flow.
Questions About Risks and Returns
The best deals don't just look good on paper; they're resilient. You need to understand how the returns might shift if things don't go exactly as planned.
An investment's strength isn't just its projected upside; it's how well it withstands downside pressure. The most critical diligence questions explore what happens when the initial assumptions prove too optimistic.
Return Sensitivity: How does the cash on cash return change over the five-year hold? Is the growth driven by aggressive rent assumptions, tight expense control, or simply paying down debt?
Key Risks: What are the top three things that could cause the actual cash flow to miss the projection? This could be a major local employer leaving town, a spike in insurance premiums, or slower-than-expected lease-up.
Exit Strategy: The exit capitalization rate is a huge variable. How does your assumption impact the deal’s overall IRR? What happens to the total return if cap rates expand by 50 or 100 basis points when it’s time to sell?
Getting comfortable with these questions will sharpen your analytical skills and give you the confidence you need to be a successful passive investor.
Frequently Asked Questions
Even after you get the hang of it, a few questions about cash on cash return always seem to pop up. Let's tackle some of the most common ones to clear up any lingering confusion and make sure you've got this metric down cold.
Does Cash on Cash Return Account for Taxes?
No. The standard cash on cash formula is a pre-tax calculation. This is a critical point to remember. It’s designed to give you a raw, unfiltered look at a property’s performance based on its operations and your initial cash investment. It completely ignores the powerful tax benefits of real estate, like deductions for mortgage interest and depreciation. Your actual take-home, after-tax return could look a lot better than the cash on cash figure alone.
How Is It Different from ROI?
While they sound similar, cash on cash return and Return on Investment (ROI) tell two very different stories. Think of cash on cash as a yearly snapshot, while ROI is the final score for the entire investment journey.
Cash on Cash Return is your annual check-up. It measures the cash you get back each year based on the cash you put in.
Return on Investment (ROI) is the big picture. It calculates your total profit over the entire hold period—including rent, appreciation, and loan paydown—and compares it to your total investment cost.
Can This Return Be Negative?
Absolutely. A cash on cash return can be negative. This happens when your property's total operating expenses plus your mortgage payments add up to more than the rental income it brings in. When your return is negative, it means you're actively contributing cash out of your own pocket just to keep it running. This is common in the first year of a major value-add project, but it's a clear signal you need cash reserves to weather the storm.
Why Might the First-Year Return Be Lower?
Don't be surprised if your first-year cash on cash return looks a little underwhelming, especially on a value-add or development project. A lower initial return is often part of the plan. A few things can drag down that first-year number:
Initial Vacancy: It takes time to find and place tenants in a new or recently rehabbed building.
Renovation Downtime: When you're actively turning units, they aren't generating income.
One-Time Costs: The first year is often loaded with stabilization costs and other expenses that won't show up again.The good news? As you stabilize the property and bring rents up to market rates, your annual cash flow should climb, pushing your cash on cash return right along with it.
Ready to explore institutional-grade real estate opportunities that align with your long-term wealth strategy? The team at Stiltsville Capital is here to provide the clarity and access you need. Schedule a confidential call with us today to discuss how our disciplined approach can help you achieve your investment goals.
Information presented is for educational purposes only and does not constitute an offer to sell or a solicitation of an offer to buy securities. Any offering is made only through definitive offering documents (e.g., private placement memorandum, subscription agreement) and is available solely to investors who meet applicable suitability standards, including “Accredited Investor” status under Rule 501 of Regulation D. Investments in private real estate involve risk, including loss of capital, illiquidity, and no guarantee of distributions. Past performance is not indicative of future results.
Comments