What Does Cap Rate Mean in Real Estate? An Essential Guide for Investors
- Ryan McDowell

- Oct 16, 2025
- 16 min read
Reading Time: 8 min | Good for: Novice (A), Informed (B)
When you're sizing up a real estate investment, you need a way to cut through the noise and get a quick read on its potential. That's where the capitalization rate, or cap rate, comes in. It's one of the most essential metrics in an investor's toolkit, giving you a clean, simple snapshot of a property's potential annual return before you even think about loans.
Think of it as the property's unlevered yield—what it would earn in a year if you bought it with all cash. This allows you to instantly compare one deal against another on a level playing field.
TL;DR: Your Executive Summary* What it is: The cap rate is a property's annual un-levered return, calculated by dividing its Net Operating Income (NOI) by its purchase price.* Why it matters: It's the fastest way to compare the relative value and risk of different investment properties, independent of financing. A lower cap rate generally means lower risk and higher value; a higher cap rate implies higher risk but a better initial yield.* What's next: Never rely on the cap rate alone. Use this guide to stress-test the assumptions behind the number and combine it with other metrics for a complete financial picture.
Decoding the Cap Rate
Before you get bogged down in complex spreadsheets, it's smart to have a solid grasp of the fundamental real estate investment terms, and cap rate is at the top of that list.
Let’s use a simple analogy. Imagine you're looking at two different apartment buildings. Building A costs $1 million and brings in $60,000 a year after expenses. Building B also costs $1 million but brings in $80,000. The cap rate is just a way of comparing the annual income to the purchase price.
Right away, you can see Building B offers a better initial return for the same investment. That’s exactly how cap rates work in real estate—they provide a standardized way to measure profitability before factoring in debt, making it an indispensable tool for that first look.
To help break it down, here’s a quick reference table.
Cap Rate At a Glance
Concept | Plain-English Meaning | Why It Matters for Investors |
|---|---|---|
Cap Rate | A property's annual return if bought with all cash. | It provides a quick, standardized way to compare potential investments. |
Net Operating Income (NOI) | All income (rent, fees) minus all operating costs (taxes, insurance). | This is the "profit" a property generates before debt payments. |
Property Value | The purchase price or what the property is currently worth on the market. | It's the "cost" part of the return-on-cost calculation. |
This table boils the concept down to its core, but let's look at the simple math that drives it all.
The Core Formula
Every real estate investor lives and breathes this simple formula. It’s elegant, powerful, and easy to remember.
Cap Rate = Net Operating Income (NOI) / Property Value
Your Net Operating Income (NOI) is the money left over after you’ve collected all the rent and paid all the necessary operating bills—like property taxes, insurance, and maintenance. The Property Value is simply what you paid for it or its current market value.
So, if a commercial building generates an NOI of $750,000 and is valued at $10 million, you just divide the two. Your cap rate is 7.5%. It's that straightforward.
This simple percentage is what allows for that "apples-to-apples" comparison between vastly different properties.
Novice Lens: Why It MattersThe cap rate is your first filter. It helps you quickly screen dozens of deals to find the handful that are actually worth a deeper dive. It answers the fundamental question, "For every dollar I invest in the property itself, what's my annual return before I borrow any money?" It's a pure measure of the asset's performance.
Calculating Cap Rate Like a Pro
A cap rate is only as reliable as the numbers you plug into it. Simple as the formula seems, disciplined underwriting demands you get its two core components right: Net Operating Income (NOI) and Property Value. Nailing these is non-negotiable if you want an accurate analysis.
It’s really a straightforward, two-step process that cuts through the noise and reveals a property's true financial pulse. First, you figure out its real annual income. Second, you divide that by its cost. Let's break it down.
Step 1: Find the Net Operating Income (NOI)
Net Operating Income (NOI) is the lifeblood of any income-producing property. It’s a clean measure of all the revenue a property generates over one year, minus all the necessary operating expenses.
Think of it as the property's annual profit before you factor in mortgage payments or income taxes.
To get to the NOI, you first need to calculate the Gross Operating Income (GOI). This is every dollar the property could possibly bring in.
Gross Operating Income (GOI) includes:
Rental Income: The main event, coming directly from tenant leases.
Other Income: Think parking fees, laundry machines, pet fees, or storage units.
Vacancy Loss: This is a critical reality check. You have to deduct potential rent from units that are empty or from tenants who don't pay.
Once you have your GOI, you subtract the Operating Expenses (OpEx)—the day-to-day costs of keeping the lights on and the property running. For a deeper dive, check out our guide on [how to find Net Operating Income](https://www.stiltsvillecapital.com/post/how-to-find-net-operating-income-a-clear-guide-for-real-estate-investors).
Common Operating Expenses (OpEx) include:
Property Taxes
Property Insurance
Utilities (if not covered by tenants)
Repairs and Maintenance
Property Management Fees
Key Exclusion: It is absolutely critical to remember that NOI is calculated before debt service. Your mortgage principal and interest payments are not considered operating expenses. Why? Because a cap rate is meant to measure the property's raw performance, independent of how the owner financed it. Big-ticket capital expenditures (like a new roof) are also kept out of this calculation.
Step 2: Divide NOI by the Property Value
With a clean, accurate NOI in hand, the last step is simple. Just divide the NOI by the property’s current market value or purchase price.
Cap Rate = Net Operating Income / Property Value
The result, which you’ll express as a percentage, is your cap rate. This number gives you the unlevered annual return you could expect if you bought the property all-cash. If you want to get your hands dirty with more examples, check out a simple guide on how to calculate cap rate on rental property to practice your skills.
Deal Lens Example: A Multifamily Acquisition
Let's put this into action with an illustrative case. Imagine you’re analyzing a 100-unit apartment complex with a $20,000,000 price tag.
Calculating Gross Operating Income (GOI):
Gross Potential Rent (100 units x $1,800/month x 12 months) = $2,160,000
Other Income (parking, laundry, etc.) = $40,000
Less: Vacancy & Credit Loss (5%) = -$108,000
Effective Gross Income (EGI) = $2,092,000
Calculating Operating Expenses (OpEx):
Property Taxes = $250,000
Insurance = $60,000
Repairs & Maintenance = $100,000
Management Fees (4%) = $83,680
Utilities & Other = $120,000
Total Operating Expenses = $613,680
Calculating Net Operating Income (NOI):
NOI = EGI - Total OpEx
NOI = $2,092,000 - $613,680 = $1,478,320
Final Cap Rate Calculation:
Cap Rate = $1,478,320 / $20,000,000
Cap Rate = 7.39%
In this deal, the property is being sold at a 7.39% cap rate. That single number immediately becomes a powerful benchmark, allowing you to compare this opportunity against other apartment buildings in the same market.
What a Cap Rate Really Tells You About an Investment
Once you have the number, the real work begins. You have to figure out what that cap rate is actually telling you about the property. It's so much more than just a simple yield metric; it's a powerful shorthand for risk, market sentiment, and ultimately, value. Getting the story right is absolutely crucial for making smart investment decisions.
The first and most important thing to get your head around is the inverse relationship between cap rates and property values. It's a simple see-saw: when property values go up, cap rates go down. And vice-versa. This dynamic is at the very heart of how real estate markets function.
The Risk and Reward Spectrum
At its core, a cap rate is a quick gut-check on the classic risk-reward tradeoff. It tells you, in a single number, how much of a return the market is demanding for the level of risk tied to a specific property.
This infographic lays it out perfectly, showing what a low vs. high cap rate really means for an investment.
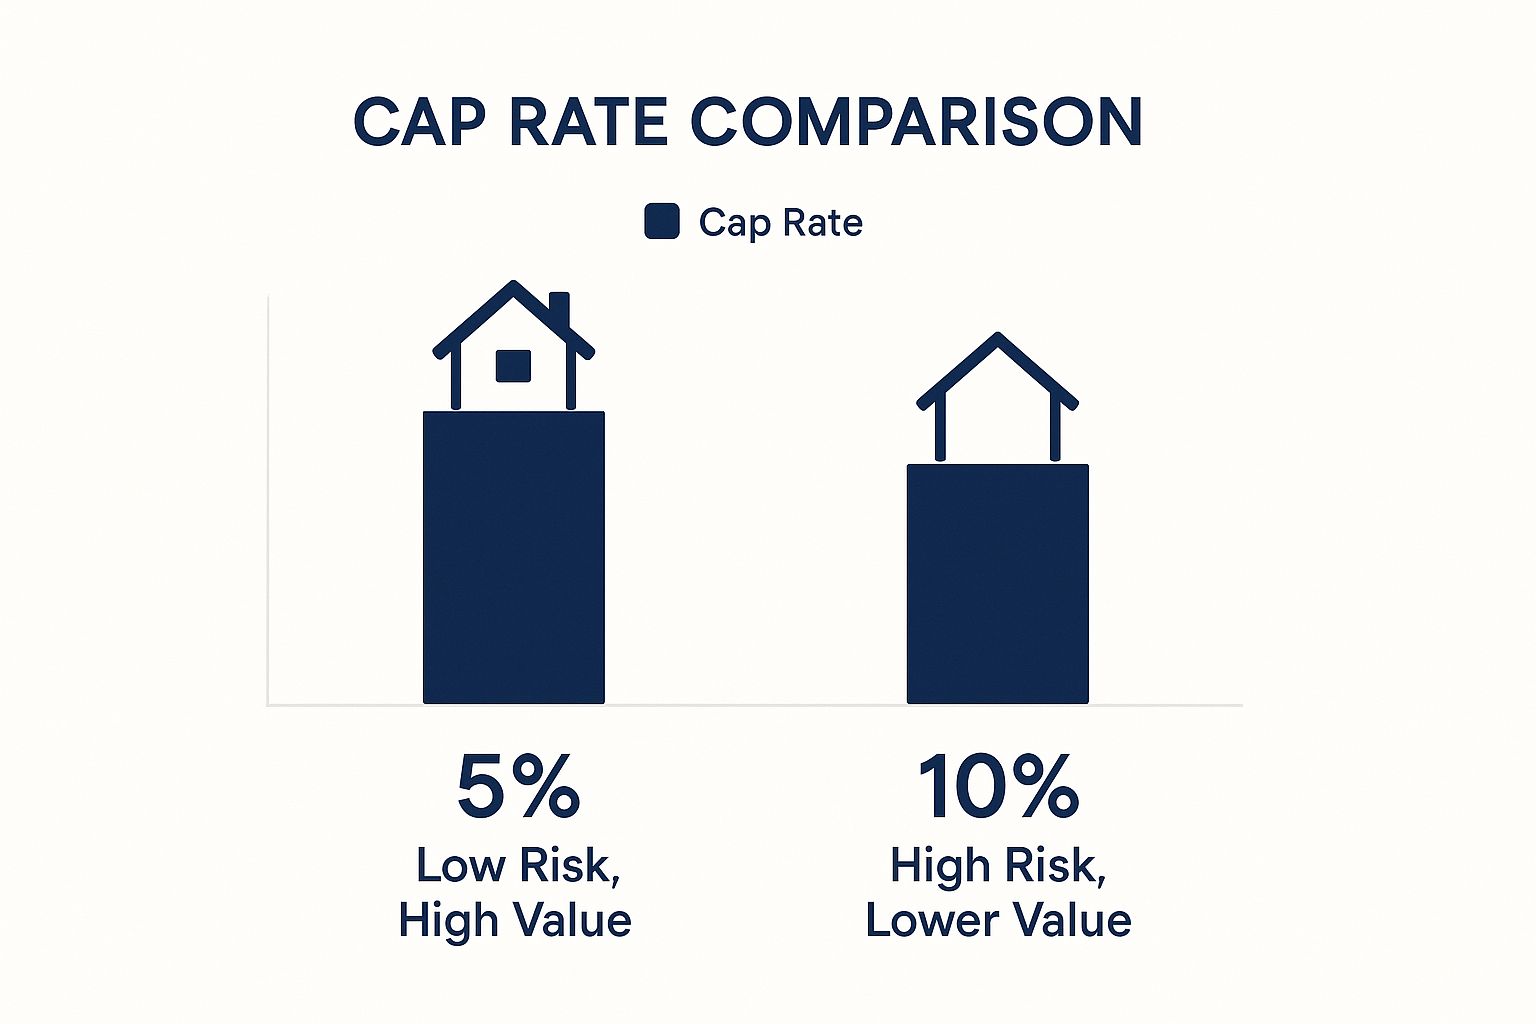
As you can see, the central idea is pretty clear—lower cap rates usually mean safer, more valuable assets, while higher cap rates suggest a lower price tag but come with a lot more risk.
Low Cap Rates (e.g., 4-6%): You'll see these on stable, high-quality assets in prime locations—think a brand-new apartment building in a major city. The market sees these as safe bets with predictable income. Investors are willing to pay a premium for that stability, which pushes the property value up and the cap rate down.
High Cap Rates (e.g., 8-10%+): These are usually attached to properties with more hair on them. Maybe it's an older building that needs a ton of work, a property in a rougher neighborhood, or an asset with shaky tenants. To get investors to bite, the potential return has to be higher. That means they'll only buy it at a lower price, which pushes the cap rate up.
A Lens for Every Investor
How you look at this risk spectrum really depends on your own strategy and experience level.
The New Investor's Lens: Savings Account vs. StockIf you're new to real estate, here's a simple analogy. A low cap rate property is like a high-yield savings account: it’s stable, secure, and gives you modest, predictable returns. A high cap rate property is more like an aggressive growth stock. It has the potential for much bigger returns, but it also has a greater chance of losing money or demanding a lot more of your time and effort.
For seasoned investors, the conversation gets a bit more technical, focusing on market trends and future growth.
The Advanced Lens: Cap Rate Compression and ExpansionSophisticated investors are always thinking about how cap rates might change over the life of the deal. Cap rate compression is what happens when market demand heats up, driving property values up and pushing cap rates down. Buying a property in an up-and-coming area and selling it later at a lower "exit" cap rate is how sponsors generate massive capital gains. On the flip side, cap rate expansion (rising rates) can kill a property's value, even if its income stays the same. Understanding these long-term trends is absolutely critical for underwriting a successful deal.
At the end of the day, a cap rate is the universal language of real estate, allowing investors to compare deals across different cities and property types. Just remember, while it's a fantastic tool, a cap rate is just a snapshot in time and doesn't factor in your financing. For that side of the story, you need to look at metrics like [what is cash on cash return](https://www.stiltsvillecapital.com/post/what-is-cash-on-cash-return-a-clear-guide-for-real-estate-investors).
The Market Forces That Shape Cap Rates
A property's cap rate is never a fixed number—it's alive, breathing with the market and constantly shifting based on a potent mix of economic trends, local vibes, and property-specific details. Anyone who tells you there's a single "good" cap rate is missing the point. It's all relative to the current climate.
An investor who really gets why cap rates are moving can see opportunities and threats long before they show up on everyone else's radar. These forces fall neatly into three big buckets, each playing a key role in whether cap rates are compressing (pushing values up) or expanding (driving them down).
Market Signal: Interest Rates & Cap Rate Spreads* Data Point: As of Q1 2024, the 10-Year Treasury yield, a key benchmark for risk-free returns, has hovered around 4.2%. Commercial real estate cap rates for all property types averaged 5.6% according to CBRE.* Interpretation: This creates a "spread" of roughly 140 basis points (1.4%). This spread is the premium investors demand for taking on the risks of real estate (illiquidity, management, etc.) over a guaranteed government bond.* Investor Take: When this spread is narrow, real estate is considered expensive relative to other investments. As the Fed navigates its rate policy, watching this spread is critical. A widening spread often signals better buying opportunities for disciplined investors.
Broad Economic Factors
First, you have to look at the big picture—the macroeconomic currents that lift or lower all boats, including commercial real estate.
Interest Rates: This is the big one. When the Fed raises rates and borrowing gets more expensive, real estate investors need a bigger return to make the numbers work on a new deal. That pressure pushes cap rates up. On the flip side, when rates fall, cheaper debt makes lower-yielding properties look a lot more appealing, pushing cap rates down.
Inflation: High inflation eats away at the future value of your money. So, naturally, investors demand a higher return right out of the gate to protect their buying power. This means they'll pay less for a property relative to its income, causing cap rates to expand. The interesting twist is that real estate is also a classic inflation hedge, since rents can be raised over time, which complicates things a bit.
Economic Growth: A humming economy with solid GDP growth and low unemployment is fantastic for real estate. Businesses are expanding, people have jobs, and demand for space—whether it's apartments, warehouses, or storefronts—goes up. That kind of optimism makes investors willing to accept lower initial returns because they’re betting on future growth, which compresses cap rates.
Local Market Conditions
Now, let's zoom in. The health of a specific city or even a single neighborhood has a massive, immediate impact on property values and their cap rates.
Job Growth and Demographics: Is a city attracting new companies and a wave of young, affluent professionals? That's a perfect storm for real estate demand. More jobs mean more people needing apartments, more shoppers for retail, and more businesses looking for office or warehouse space. This kind of robust demand drives property values up and cap rates down.
Supply and Demand: At its core, all real estate is local. If a developer floods a market with a dozen new apartment complexes, that firehose of new supply can put a lid on rents and occupancy, pushing cap rates up for multifamily deals. Contrast that with a market like Miami or coastal California, where it's incredibly tough to build anything new. The limited supply creates intense competition for existing properties, forcing cap rates lower.
Local Regulations: Never underestimate city hall. Favorable zoning laws, reasonable property taxes, and pro-growth development policies can make a city a magnet for investment, compressing cap rates. A town known for red tape and high taxes? You'll probably see the opposite effect.
Historically, cap rates have always danced to the tune of these wider economic and market trends. You'll often hear a general benchmark of 4% to 12% for rental properties, but the right number is always dictated by what's happening on the ground. You can discover more insights about cap rate and yield to see how these factors really play out.
Property-Specific Attributes
Finally, we get down to the asset itself. You could have two buildings right next to each other on the same street trading at different cap rates because of their unique profiles.
Tenant Quality and Lease Terms: A building anchored by a Starbucks and a national bank on fresh 10-year leases is a sleep-well-at-night investment. That security is worth paying a premium for, which means a low cap rate. A property with a bunch of mom-and-pop tenants on short-term leases? That's a different story—and the higher risk demands a higher cap rate.
Building Age and Condition: A brand-new, top-of-the-line industrial facility won't need a new roof or HVAC system for a long, long time. An older, beat-up property, on the other hand, comes with a laundry list of future capital expenses. Investors price that risk in by paying less for the building, which translates to a higher cap rate.
Asset Class: Not all property types are created equal. Asset classes like multifamily and industrial logistics are seen as steady, essential parts of the economy, so they typically trade at lower cap rates. In contrast, hotels and speculative office buildings are much more tied to economic cycles and carry more risk, so investors expect higher cap rates to compensate.
Using Cap Rates for Smart Investment Decisions
Moving from textbook theory to the real world, the cap rate stops being a simple percentage and becomes a powerful tool for making sharp, informed investment decisions. Experienced investors don't just calculate cap rates; they use them to quickly size up opportunities, gut-check pricing, and understand the potential of a deal.
Think of it as a universal translator. It allows for a swift, apples-to-apples comparison between wildly different properties. Whether you're eyeing a data center in Ashburn or a multifamily complex in Austin, the cap rate strips away the noise of financing and gives you a clean look at the asset's raw earning power. This is the critical first filter that helps narrow a universe of potential deals down to the handful that are actually worth your time.
A Tool for Valuation
Beyond just a quick comparison, you can flip the cap rate formula on its head to create a powerful valuation tool. By rearranging the pieces, you can estimate what a property should be worth based on its income and what the market is currently paying for similar assets. It’s a foundational technique in any commercial real estate pro’s toolkit.
The formula is straightforward:
Estimated Property Value = Net Operating Income (NOI) / Market Cap Rate
Let’s say you know that similar properties in your target neighborhood are consistently trading at a 6.0% cap rate. You're now analyzing a building that generates $300,000 in NOI. With this info, you can get a quick read on its value.
Estimated Value = $300,000 / 0.06 = $5,000,000
This calculation gives you an immediate, data-backed benchmark. If the seller is asking for $6 million, you instantly know their price works out to a 5.0% cap rate ($300,000 / $6,000,000). You'd be paying a premium compared to the market. But if they're asking $4.5 million, you're potentially looking at a deal priced at an attractive 6.67% cap rate—a signal that this opportunity deserves a much deeper look.
Know Its Limits
While the cap rate is indispensable, it is absolutely not a silver bullet. Relying on it exclusively is a classic rookie mistake. Its greatest strength—its simplicity—is also the source of its biggest blind spots. At its core, a cap rate is just a snapshot of a single moment in time, reflecting only the first year's unlevered return.
Here’s what a cap rate won’t tell you:
The Impact of Financing: The formula completely ignores debt service. This means it offers zero insight into your actual cash flow or returns after the mortgage is paid. A high cap rate deal can easily become a negative cash flow property with the wrong loan.
Future Performance: It doesn’t see the future. A cap rate won't account for projected rent growth, planned value-add improvements, or changes in operating expenses down the road. A low starting cap rate might be perfectly acceptable if you have a clear plan to dramatically boost the NOI.
The Time Value of Money: The metric treats all dollars as equal, ignoring the fundamental principle that a dollar today is worth more than a dollar tomorrow. It simply can't capture the full, long-term financial story of an investment.
Building a Complete Financial Picture
To overcome these limitations, savvy investors build a more complete financial picture by pairing the cap rate with other key metrics. This approach creates a multi-dimensional view of a deal, covering both its immediate potential and its long-term performance.
Cash-on-Cash Return: This metric gets personal. It answers the crucial question: "What is my annual return on the actual cash I put into this deal?" You calculate it by dividing your pre-tax cash flow (NOI minus debt service) by your total cash invested. This is your first look at levered returns.
Internal Rate of Return (IRR): This is a much more sophisticated metric that calculates the total annualized return over the entire life of the investment, from the day you buy it to the day you sell it. It accounts for the time value of money, factoring in all cash flows, loan amortization, and the final profit from the sale.
By using these metrics together, you get a holistic view. The cap rate gives you an initial benchmark, the Cash-on-Cash Return reveals your immediate yield on capital, and the IRR paints the complete picture of long-term wealth creation.
Your Due Diligence Checklist for Evaluating Cap Rates

A cap rate is only as solid as the assumptions holding it up, and a sharp investor knows to question everything. This checklist of questions to ask a sponsor will help you stress-test their numbers and ensure their valuation is grounded in reality, not just wishful thinking.
Questions for Analyzing the In-Place Cap Rate
The starting cap rate—the "in-place" rate—is your baseline for what the property is worth today.
What specific market data and recent comparable sales (comps) are you using to justify this valuation?
Can I see a detailed breakdown of the Trailing-12 (T-12) financials to verify the historical NOI?
Are there any one-time expenses or income items inflating the historical NOI?
How does this property’s occupancy and rent roll stack up against the market average?
What is the weighted average lease term (WALT), and are there any major lease expirations coming up?
Questions for Analyzing the Pro-Forma and Exit Cap Rate
Where an investment is headed is just as important as where it starts. The exit cap rate is a huge driver of your final return.
What assumptions are behind your projected NOI growth? Are they banking on massive rent hikes or dramatic expense cuts?
How does your projected exit cap rate compare to today's market rates and historical trends? (A conservative sponsor will underwrite an exit cap that is higher than the entry cap.)
What are the biggest risks that could prevent you from hitting that projected exit value?
Have you run a sensitivity analysis showing how the deal performs if interest rates rise or the exit cap expands?
Your Final Questions on Cap Rates
To wrap things up, let's tackle a few of the most common questions that come up when investors are getting their arms around cap rates. These are the details that often make the difference between a good deal and a great one.
What’s a Good Cap Rate, Anyway?
This is the million-dollar question, and the honest answer is: it depends. A "good" cap rate is completely relative to the property type, market, and risk profile. For a brand-new, fully-leased apartment building in a Tier 1 city (a Class A asset), a 4-5% cap rate could be fantastic. For an older retail center in a secondary market needing renovations, you'd want to see something closer to 7-10% to justify the risk. The key is to compare a property's cap rate to its direct competitors in the same submarket.
How Do Cap Rates Change Across Different Property Types?
Cap rates can swing pretty wildly from one asset class to another, all based on perceived stability and growth potential. Multifamily and industrial properties often trade at lower cap rates because investors see them as steady, essential assets. In contrast, a hotel or a speculative office property might have a higher cap rate because their income is more sensitive to economic cycles, and investors demand a higher return to compensate for that volatility.
Does a Cap Rate Factor in My Mortgage Payment?
Nope, and this is a critical point. The cap rate formula is built on Net Operating Income (NOI), which is calculated before subtracting any debt payments. This is intentional. It strips out financing to give you a pure, apples-to-apples look at how a property performs on its own. This lets you compare deals fairly, regardless of how they are financed. To see how a deal performs with a specific loan, you need to calculate metrics like the Cash-on-Cash Return and IRR.
At Stiltsville Capital, we believe that well-structured real assets can be a prudent, resilient component of a long-term wealth strategy. Disciplined underwriting is the cornerstone of successful real estate investing, and understanding metrics like cap rate is the first step.
If you have more questions about evaluating your next investment, we invite you to explore our approach.
Information presented is for educational purposes only and does not constitute an offer to sell or a solicitation of an offer to buy securities. Any offering is made only through definitive offering documents (e.g., private placement memorandum, subscription agreement) and is available solely to investors who meet applicable suitability standards, including “Accredited Investor” status under Rule 501 of Regulation D. Investments in private real estate involve risk, including loss of capital, illiquidity, and no guarantee of distributions. Past performance is not indicative of future results.
Comments