top of page
Search

Reading Time: 8 min | Good for: Novice Investors (A), Informed Principals (B)


TL;DR: Your Quick Guide to Cap Rate


  • What It Is: The capitalization (cap) rate is a simple, powerful metric showing a rental property's potential annual return on an all-cash basis. It’s calculated as Net Operating Income (NOI) ÷ Property Value.

  • Why It Matters: It allows for quick, apples-to-apples comparisons of different properties by removing the variable of financing. It’s your first gut check on price, risk, and relative value.

  • What's a "Good" Cap Rate? It depends. Lower cap rates (e.g., 4-5%) typically mean lower risk and a higher price. Higher cap rates (e.g., 8%+) suggest higher potential returns but often come with higher risk. Market context is everything.

  • Investor Action: Use the cap rate as your starting point, but never your only metric. Always dig deeper with a full due diligence checklist and analyze cash-on-cash return and IRR to see the complete picture.


What a Cap Rate Really Tells You About a Rental Property


ree


If you're evaluating a rental property, the cap rate is one of the first, most powerful numbers you'll encounter. It’s a clean metric that shows you a property's potential rate of return before any loans or financing enter the picture. Think of it as the property's raw, unleveraged earning power.


The capitalization rate is the universal language of real estate investing. It's the metric that lets investors quickly size up different properties and compare their income potential on an even playing field.


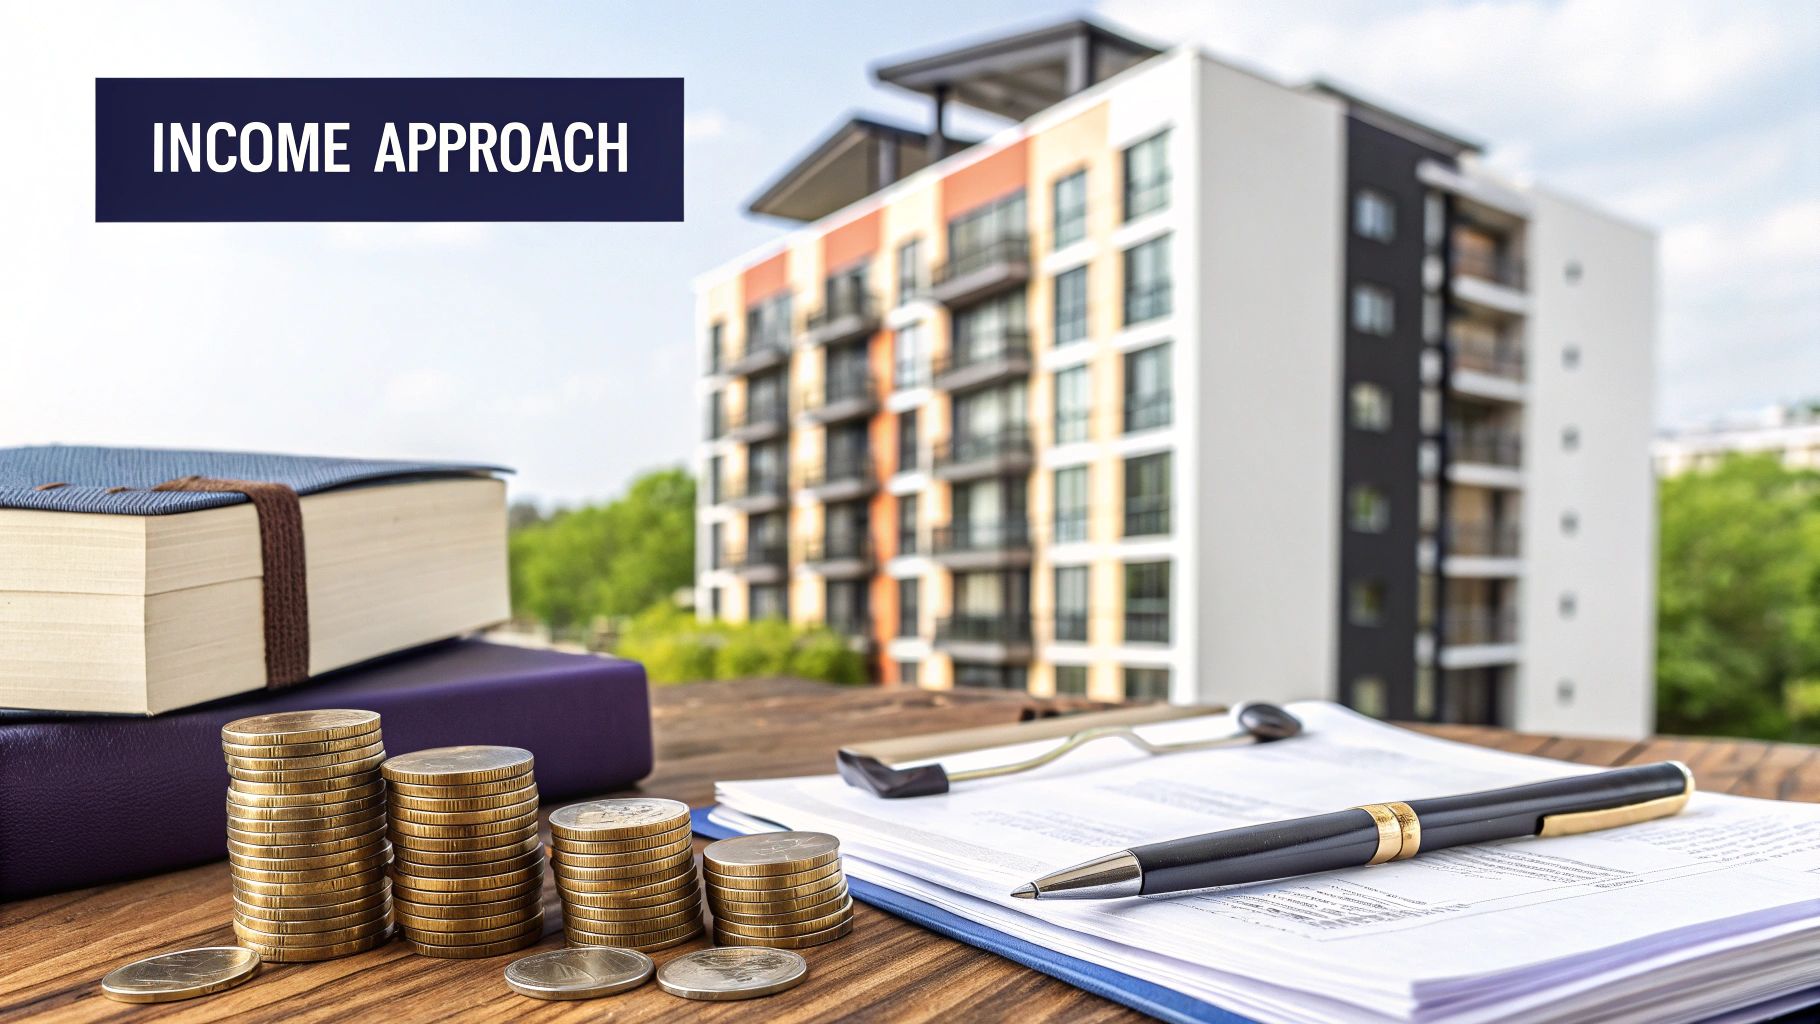
A great way to think about it is like the yield on a bond. If a bond costs $1,000 and pays you $50 a year, its yield is 5%. The cap rate works the same way. If a rental property generates $50,000 in Net Operating Income (NOI) and is on the market for $1,000,000, its cap rate is 5%.


This simple parallel frames the cap rate perfectly: it’s the unleveraged annual return you’d make if you bought the property with all cash.


Why This One Number Is So Important


This single percentage is your best friend for an initial gut check. It helps you sift through deals quickly without getting lost in the weeds of mortgage details, which are different for every buyer. By removing financing from the equation, the cap rate gives you a pure look at how well the property itself performs.


This is why everyone, from a first-time landlord to an institutional investment firm like Stiltsville Capital, leans on it. It gives you a crucial first impression, helping you answer the big questions right away:


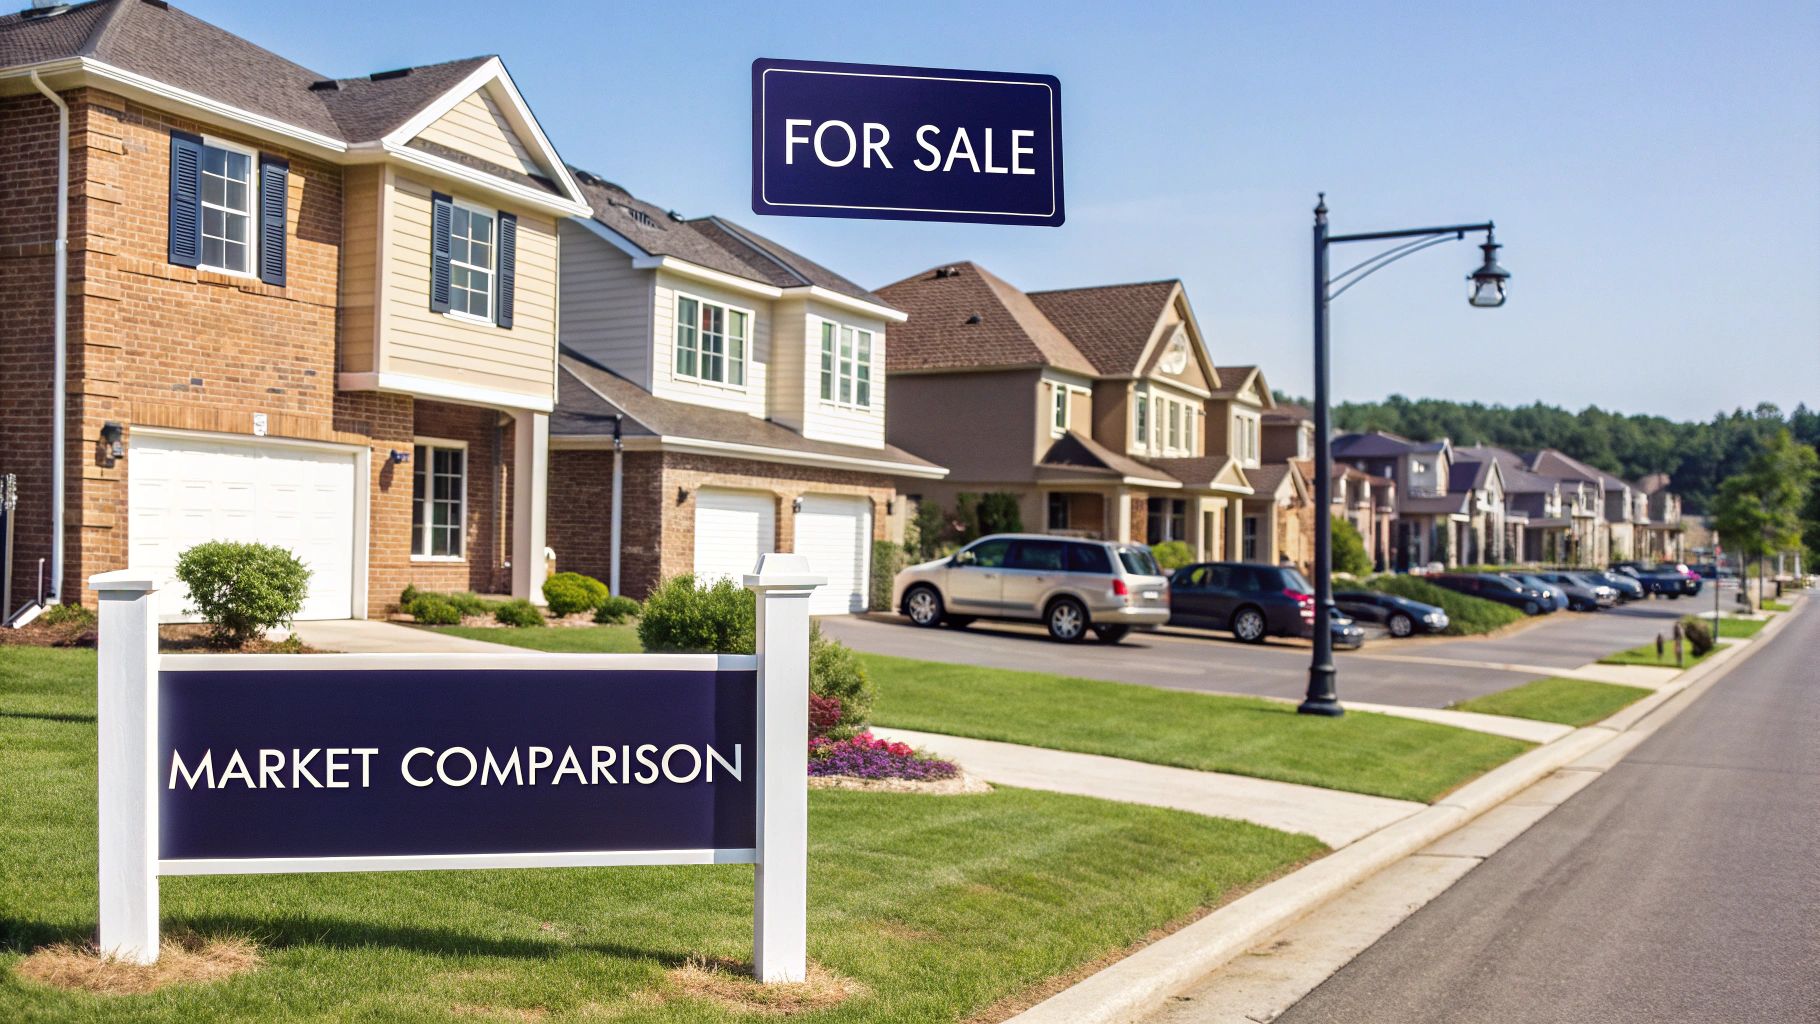
  • Is the price right? Stacking a property's cap rate against what similar properties have recently sold for (the "market comps") tells you if it's overpriced, underpriced, or right in line with the going rate.

  • What's the risk level? Generally, a higher cap rate signals a higher potential return, but it often comes with higher perceived risk. A lower cap rate usually points to a safer, more stable asset in a prime location with strong demand.

  • How does it compare to other deals? When you’re looking at multiple opportunities, the cap rate lets you make a quick, apples-to-apples comparison of their income potential relative to their price tag.


Novice Lens: Why It Matters Don't let the jargon scare you. A cap rate is just a quick health check on a rental property. It tells you how hard your money will work for you based only on the building's ability to make money, making it the perfect starting point for any serious evaluation.

Getting comfortable with this metric is the first step toward building the confidence to analyze deals like a professional. While it's not the only number you'll ever use, it’s without a doubt the most important one to start with.


How To Confidently Calculate Cap Rate


Calculating a property's cap rate is straightforward, but the number you get is only as good as the numbers you put in. The formula itself is simple: just divide the property's Net Operating Income (NOI) by its current market value. The real work—and where most investors trip up—is mastering those two inputs, especially the NOI.


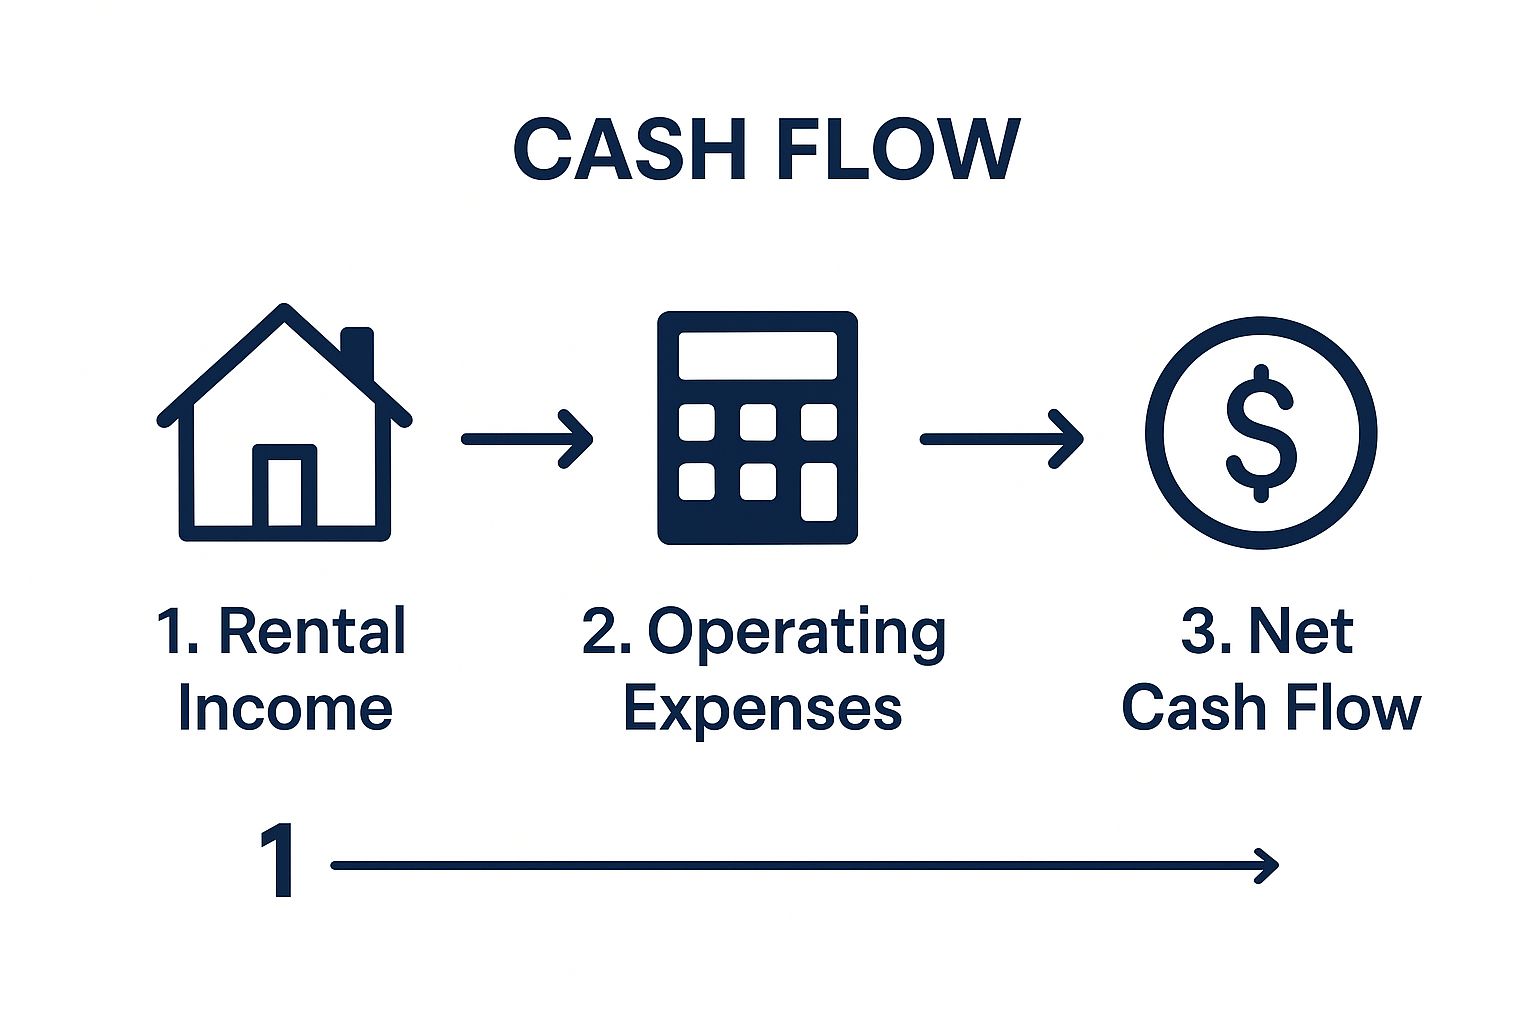
This simple visual breaks down the process into three core steps.


ree


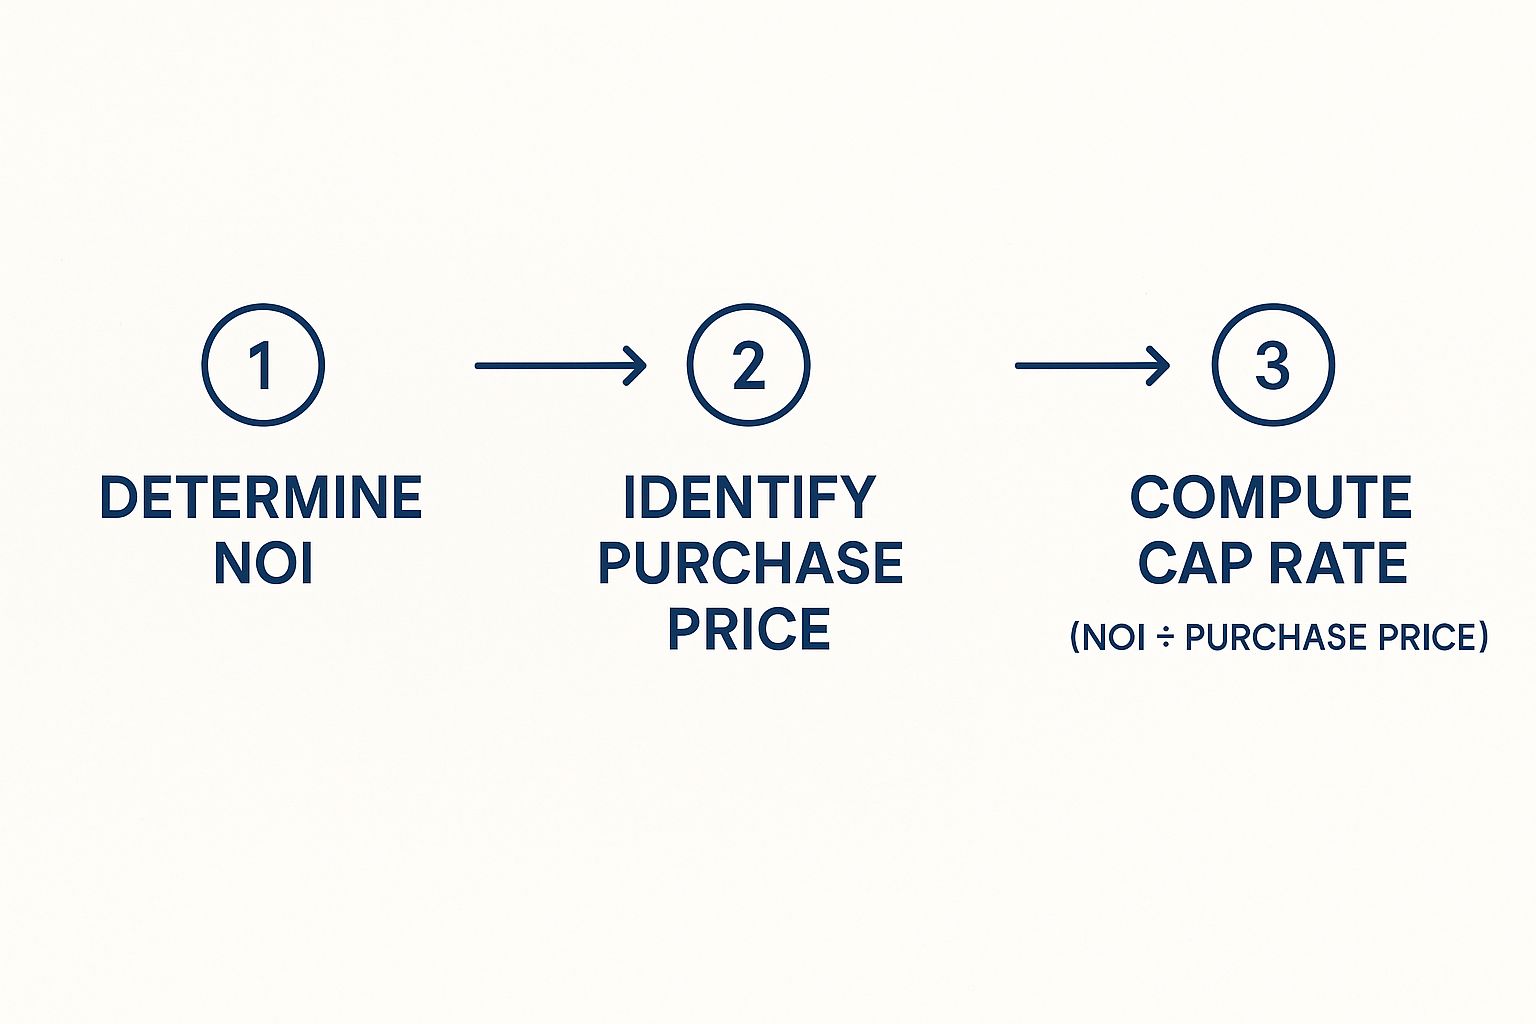
As you can see, the heavy lifting happens before you ever do the final division. It's all about nailing down an accurate NOI and a realistic property value.


Mastering Net Operating Income


Think of Net Operating Income (NOI) as the financial heartbeat of a rental property. It’s the total income the property brings in over a year, minus all the necessary operating expenses. Essentially, it’s the property's annual profit before you factor in loan payments (debt service) or income taxes.


Getting this right requires discipline. You have to know exactly what to include and what to leave out.


Income sources to include:


  • Gross Scheduled Rent (the total rent you'd collect if every unit was occupied 100% of the time).

  • Other Income from things like parking spots, laundry machines, storage units, or pet fees.


Operating expenses to subtract:


  • Property taxes

  • Property insurance

  • Property management fees

  • Utilities (if you, the owner, are paying for them)

  • Routine maintenance and repairs

  • Landscaping and snow removal

  • Pest control

  • General administrative costs

  • A vacancy allowance (usually 5-10% of gross rent to account for empty units).


A common rookie mistake is confusing NOI with cash flow. True NOI is calculated before debt service. If you include your mortgage payments, you'll artificially crush your NOI and end up with a skewed, inaccurate cap rate.

Deal Lens: Example Of A Multifamily Property


Let's walk through an illustrative example with a hypothetical 10-unit apartment building. This will show you how to build an NOI from the ground up and use it to find the cap rate.


Property Details:


  • Purchase Price: $2,000,000

  • Units: 10, each renting for $1,500/month


Step 1: Calculate Annual Income


First, let's figure out the property’s total potential income for the year.


  • Gross Potential Rent: 10 units x $1,500/month x 12 months = $180,000

  • Other Income (Laundry/Parking): $5,000 per year

  • Total Potential Income: $180,000 + $5,000 = $185,000


Now, we must be realistic and account for vacancies. A 5% vacancy allowance is a smart, conservative estimate.


  • Vacancy Allowance: $185,000 x 5% = $9,250

  • Effective Gross Income (EGI): $185,000 - $9,250 = $175,750


Step 2: Tally Annual Operating Expenses


Next, we subtract all the costs required to keep the property running smoothly. Here is an illustrative breakdown.


Illustrative Net Operating Income (NOI) Calculation


  • Effective Gross Income (EGI): $175,750

  • Property Taxes: ($20,000)

  • Insurance: ($7,500)

  • Property Management (8% of EGI): ($14,060)

  • Repairs & Maintenance: ($10,000)

  • Utilities (Owner-Paid): ($6,000)

  • Total Operating Expenses: ($57,560)

  • Net Operating Income (NOI): $118,190


This step-by-step approach ensures no expense is overlooked and gives us a reliable NOI figure.


Step 3: Calculate NOI And Cap Rate


With our income and expenses locked in, we can finalize the NOI.


  • Net Operating Income (NOI): $175,750 (EGI) - $57,560 (Expenses) = $118,190


Finally, we plug this into the cap rate formula using the property’s purchase price.


  • Cap Rate = NOI / Purchase Price

  • Cap Rate = $118,190 / $2,000,000

  • Cap Rate = 5.91%


This 5.91% cap rate represents the unleveraged return on the asset. It gives you a clean, simple metric to compare this deal against other investment opportunities. For a deeper dive, check out our definitive investor guide on how to calculate cap rate for real estate.


What a Good Cap Rate Actually Looks Like


ree


Once you have a cap rate, the art is learning how to interpret what that number is telling you about a property's risk, potential, and market position.


The first concept to grasp is the seesaw relationship between cap rates and property values. When one goes up, the other typically comes down.


  • Low Cap Rate: A low number, say 4-5%, usually points to a higher property value. It often signals a stable, high-quality asset in a prime location with strong tenant demand. The market sees it as a "safe" bet, so investors are willing to pay a premium, accepting a lower initial return.

  • High Cap Rate: A high cap rate, like 8-10%, suggests a lower property value. This could be a red flag for higher risk—perhaps it's in a less desirable area, needs significant work, or is poorly managed. To take on that risk, investors demand a much higher potential return.


There’s no single "good" cap rate. It all comes down to your investment strategy and risk tolerance. A stable, low-cap-rate property might be perfect for wealth preservation, while a high-cap-rate deal could be a goldmine for a value-add investor skilled in turning properties around.


Factors That Shape Cap Rates


A cap rate isn't created in a vacuum. It’s a living number that reflects powerful forces, from the property itself to the economy at large.


Here are the key drivers:


  • Property Type: A multifamily complex in a growing city carries a different risk profile than a small retail space with a single tenant. Assets like data centers and medical offices often trade at lower cap rates because they have long-term leases with creditworthy tenants.

  • Location, Location, Location: An apartment building in a booming Sunbelt city will have a much lower cap rate than an identical building in a town with a shrinking population. Proximity to jobs, transportation, and amenities directly impacts perceived risk.

  • Economic Tailwinds: Macroeconomic factors, especially interest rates, play a massive role. When interest rates climb, borrowing gets more expensive. This puts upward pressure on cap rates because investors need higher returns to justify the deal.


We've seen this play out in U.S. multifamily apartments. After the Global Financial Crisis, cap rates were high due to risk aversion. As the economy recovered and rates fell, cap rates compressed, hitting all-time lows around 4.1% in 2021. By early 2024, Fed rate hikes had pushed them back up toward 5.2%, proving their sensitivity to financial conditions.


The Art of Cap Rate Compression


For savvy investors, the cap rate isn’t just an analytical tool—it’s a target. A powerful value-add strategy is built around "cap rate compression." The goal is simple: buy a property at a high cap rate, improve its operations and physical condition, and force the cap rate down. This directly increases the property's value.


Here’s how it works: An investor buys an older, C-class apartment building at an 8% cap rate. It’s underperforming because the units are dated and management is inefficient. 1. Execute the Plan: They invest capital to renovate apartments, add modern amenities, and bring in professional managers. This allows them to raise rents and cut wasteful spending, boosting the Net Operating Income (NOI). 2. Force Appreciation: Two years later, the property is a desirable B-class asset with a much healthier NOI. The market now sees it as a less risky, more stable investment. 3. Exit at a Lower Cap Rate: The investor can now sell the property at a 6% cap rate. That combination of a higher NOI and a lower exit cap rate creates a massive increase in the property's sale price—and a significant win for investors.

This strategy is the engine behind countless successful real estate deals. For a deeper look at market benchmarks, check out our complete guide on what is a good cap rate for real estate investors.


Finding Your Bearings with Market Benchmarks


A cap rate by itself is just a number; it’s meaningless without context. A 5% cap rate for a rental property could be a steal in a bustling downtown core but a red flag in an unproven market. To make smart decisions, you must ground your analysis in reality by looking at what similar properties are trading for.


This is where you need to tap into institutional-grade data. Reports from industry heavyweights like CBRE and JLL provide that crucial perspective, laying out typical cap rate ranges for different commercial real estate sectors.


Mapping Cap Rates Across Asset Classes


Not all properties are created equal, and their risk and return profiles are reflected in their cap rates. A brand-new, fully leased Class A apartment building will almost always trade at a lower cap rate than a value-add industrial warehouse that needs work.


Here are some general benchmark ranges to get you started (as of mid-2024):


  • Multifamily: Typically 5.0% - 5.75%. This sector is a favorite due to consistent tenant demand, making it a lower-risk play.

  • Industrial/Warehouse: Often 5.5% - 6.5%. Fueled by e-commerce, logistics and warehouse space has been a top performer.

  • Retail (Neighborhood/Service): Usually 6.75% - 7.5%. Higher cap rates reflect the added risks and ongoing shifts in the retail landscape.

  • Medical Office: Can be 6.0% - 7.0%. Investors value these for their stable, high-credit tenants in the resilient healthcare industry.


Remember, these are broad averages. Rates can swing wildly depending on the city, neighborhood, and building quality. The key is to compare your target property to its direct competition.


Understanding Historical Cap Rate Cycles


Cap rates move with the economy and credit markets. The sharpest investors don't just look at today's numbers; they study historical trends to understand where we are in the cycle.


Historically, cap rates fluctuate within a somewhat predictable range. A deep dive into historical data on cap rates and real estate cycles shows the long-run average for institutional real estate hovers around 7.6%. During boom times, like from 2003-2007, a flood of capital pushed cap rates down. Then, when the 2007-2009 financial crisis hit, credit dried up and cap rates shot up as property values tumbled.


Market Signal Box: Cap Rate Expansion (Q2 2024) * The Signal: Market reports from mid-2024 show "cap rate expansion" across the board. In simple terms, cap rates have been climbing from the historic lows seen a few years ago. * The Driver: This shift is almost entirely due to the Federal Reserve's higher interest rate policy. When it costs more to borrow, investors demand a higher initial return—a higher cap rate—to make a deal pencil out. * Investor Take: This is a double-edged sword. Rising cap rates can pressure the value of properties you already own. But for buyers with capital ready to deploy, it's a significant opportunity. This environment allows disciplined investors to acquire high-quality assets at more attractive initial yields than what was possible just 24 months ago.

Recognizing the Limits of Cap Rate Analysis


ree


To build a resilient investment portfolio, you have to know the limits of your tools. The cap rate for rental property is a brilliant first-glance metric—a snapshot of a property’s raw earning power. But treating this snapshot as the full picture is a critical error.


Relying solely on cap rates is like driving a car by only looking in the rearview mirror. It tells you where the property stands today but offers zero insight into where it's headed.


The Static Nature of a Dynamic Investment


A cap rate's biggest weakness is that it's a static calculation for a dynamic asset. Real estate performance evolves. A simple cap rate calculation fails to account for critical value drivers that sophisticated investors focus on.


These blind spots include:


  • Future Rent Growth: Does the local market support rent increases? A property in a high-growth corridor has a much brighter future than one in a stagnant area—a detail the current cap rate won't reveal.

  • Changes in Vacancy: A new employer moving to town could slash vacancy rates and boost future income. Conversely, a major employer leaving could do the opposite.

  • The Power of Financing: Cap rates are unleveraged. They completely ignore how smart debt can magnify returns. A property with a modest 6% cap rate could deliver a stellar 15% cash-on-cash return with the right financing.

  • Value-Add Potential: The cap rate reflects the property as-is. It doesn’t capture the upside a skilled sponsor can unlock through renovations, better management, or repositioning the asset.


Debunking a Common Myth: Higher Is Not Always Better


New investors often fall into the trap of chasing the highest possible cap rate, assuming it automatically equals a better deal. This can be a costly mistake. An unusually high cap rate is often a warning sign—a signal of distress, a bad location, deferred maintenance, or unstable tenancy.


A lower cap rate on a well-located, professionally managed asset can often produce superior long-term, risk-adjusted returns than a high-cap-rate property with a mountain of hidden problems.

Experienced sponsors hunt for properties where the current cap rate doesn't reflect the potential NOI after a strategic business plan is executed.


Risk & Mitigation in Cap Rate Analysis


  • Risk: Market Blindness * Mitigation: Conduct in-depth market analysis on job growth, population trends, and new supply. A static cap rate won't warn you of a looming oversupply issue.

  • Risk: Ignoring Property Condition * Mitigation: Perform thorough due diligence, including physical inspections and capital expenditure projections. A high cap rate might be masking a money pit.

  • Risk: Overlooking Tenant Quality * Mitigation: Analyze the rent roll for tenant creditworthiness, lease terms, and expiration dates. A building full of tenants on month-to-month leases is riskier.

  • Risk: Miscalculating Future Potential * Mitigation: Build a dynamic financial model (pro forma) that projects cash flows over the entire hold period, factoring in rent growth, renovations, and exit strategy.


By moving beyond a single number, investors can paint a much more realistic picture of a property's true potential.


Looking Beyond Cap Rate: The Investor's Toolkit


To get the full story, disciplined investors layer their analysis with other key performance indicators.


  • Cash-on-Cash Return: This metric shows the annual pre-tax cash flow relative to the total cash invested. It’s a powerful measure of how hard your actual invested capital is working, incorporating the effects of leverage.

  • Internal Rate of Return (IRR): The IRR calculates the total annualized return over the entire investment holding period, factoring in your initial investment, ongoing cash flows, and the final sale. It gives a holistic view of profitability over time.


In 2024, cap rates expanded significantly across major commercial real estate sectors. As noted by the CFA Institute blog, the U.S. multifamily sector saw a rise of approximately 195 basis points, reflecting higher financing costs and a broad adjustment in property valuations. To learn more, read our guide on the capitalization rate formula for real estate.


Your Cap Rate Due Diligence Checklist


Analysis is one thing; action is another. A cap rate is only as good as the assumptions behind it, and a smart investor knows what to ask to get the real story. Before you commit to a rental property deal, use this checklist to guide your conversation with the deal sponsor.


Think of these questions as a way to peel back the layers of the pro forma and stress-test the investment thesis.


Scrutinizing the Numbers


First, validate the building blocks of the cap rate—the NOI and the property's value. This ensures your baseline is solid.


  • How did you calculate the NOI? Ask for a detailed breakdown of every income and expense item. Are one-time fees juicing the income? Are major maintenance items conveniently omitted?

  • What vacancy rate did you assume? See if the assumed rate matches the property's history and local market comps. An overly optimistic vacancy assumption is a classic way to inflate NOI.

  • Are there any major capital projects planned that aren't in the operating budget? A planned roof replacement or HVAC overhaul are critical costs to understand the property's true cash needs.


Investor Takeaway: A sponsor's answers reveal their discipline. Clear, conservative assumptions mark a seasoned operator. Vague answers or aggressive projections are a major red flag.

Understanding the Market and Exit Strategy


A deal's success depends on its future. The exit cap rate is one of the most important assumptions in any model as it determines the projected sale price.


  • How does this cap rate compare to recent, verified sales of similar properties in this submarket? Ask for specific "comps." If their number is an outlier, they need a compelling explanation.

  • What's the projected exit cap rate? A responsible sponsor will almost always underwrite a higher (more conservative) exit cap rate than their entry cap. This builds in a cushion for market changes.

  • What specific steps in the business plan will improve the NOI? You're looking for an actionable plan—specific renovations, new amenities, or better management—not just hope for "market improvement."


Asking these questions helps you confirm the story behind the numbers and ensures the cap rate for a rental property represents a real opportunity.


Got Questions About Cap Rates? We've Got Answers.


To wrap up, let's tackle a few common questions that arise when investors start using cap rates to analyze deals.


How Do Interest Rates Affect Cap Rates?


Think of cap rates and interest rates as dance partners—they usually move in the same direction. When the Federal Reserve hikes interest rates, loans get more expensive. To make a deal work with pricier financing, investors need a better initial return. This pressures sellers to lower their asking price, which in turn pushes cap rates higher. Conversely, when interest rates drop, borrowing gets cheaper, and cap rates often compress lower.


Can a Cap Rate Be Negative?


Technically, yes, but it’s a massive red flag. A negative cap rate means the property is spending more on operating expenses than it’s bringing in from rent. In plain English, the property is bleeding cash before the mortgage is even considered. An asset like this is not just failing to produce income; it's actively draining money. While a bold value-add plan might target a property with a razor-thin cap rate, a negative one screams "deep financial trouble."


Which Price Should I Use in the Formula?


For an accurate picture, always use the property's current market value or a recent, comparable sales price. Don't get distracted by the seller's listing price. A listing price is just an optimistic starting point. Basing your analysis on an inflated asking price will give you an artificially low cap rate, making a potentially good deal look terrible. Ground your numbers in reality.


At Stiltsville Capital, we believe that disciplined underwriting is the key to building lasting wealth in real estate. When you truly understand metrics like the cap rate, you are in a much stronger position to identify and secure high-quality investment opportunities that align with a prudent, long-term wealth strategy.


If you’d like to learn more about our approach and see our current offerings, we invite you to schedule a confidential call with our team.


Information presented is for educational purposes only and does not constitute an offer to sell or a solicitation of an offer to buy securities. Any offering is made only through definitive offering documents (e.g., private placement memorandum, subscription agreement) and is available solely to investors who meet applicable suitability standards, including “Accredited Investor” status under Rule 501 of Regulation D. Investments in private real estate involve risk, including loss of capital, illiquidity, and no guarantee of distributions. Past performance is not indicative of future results.


Reading Time: 8 min | Good for: Novice Investors (A), Family Office Principals (B)


Understanding real estate property valuation methods is the bedrock of disciplined investing. At its core, valuation is the framework for determining what a property is truly worth. Investors primarily use three battle-tested methods: the Sales Comparison Approach, the Income Approach, and the Cost Approach.


Smart investors don't just pick one; they use all three to triangulate a value they can confidently stand behind, ensuring every decision is backed by data, not just a hunch.


Why Property Valuation Is Your Most Critical Tool


Think of a property's asking price as a suggestion, not a fact. The real value is a number you must discover for yourself through sharp, evidence-based analysis. Valuation isn’t a stuffy academic exercise—it’s the fundamental process that separates a strategic investment from a speculative gamble. It is the heart of sound underwriting.


Without a solid grasp of valuation, an investor is flying blind. You can't accurately assess risk, project returns, or spot a genuinely undervalued asset.


These three primary methods are like different camera lenses, each giving you a unique perspective on the asset's worth.


  • The Sales Comparison Approach asks: What are similar properties selling for right now?

  • The Income Approach asks: How much cash flow can this property generate?

  • The Cost Approach asks: What would it cost to build this exact property from scratch today?


Each method comes with its own trade-offs in terms of time, cost, and precision.


As you can see, the Sales Comparison and Income approaches usually provide a more accurate read on existing commercial properties. But the Cost Approach is indispensable when you're evaluating a one-of-a-kind asset or a new development project.


A Foundation Built on Economic Principles


These methods weren't just pulled out of thin air. The history of real estate property valuation goes back centuries, evolving as economies became more complex. While ancient societies simply valued land for power, the formal techniques we rely on today were sharpened during the industrial and urban booms of the 19th century.


They’re grounded in solid economic principles, like the idea that market price is set by supply and demand, or that present value can be determined by calculating the worth of future income.


Investor Take: Most people see an appraisal as a single number. We see it as a story. The final valuation is the conclusion, but the real narrative is written in the assumptions, the adjustments, and the weight given to each method. True diligence begins when you start asking questions about that narrative.

Overview of Core Valuation Methods


To make sense of it all, here's a quick cheat sheet comparing the three main approaches.


Valuation Method

Core Principle

Best For

Primary Limitation

Sales Comparison Approach

A property is worth what similar properties have recently sold for.

Standard property types (offices, apartments, retail) with lots of recent sales data.

Can be unreliable in slow markets or for unique, hard-to-compare properties.

Income Approach

A property's value is based on the income it can generate.

Income-producing assets like multi-tenant office buildings, retail centers, and industrial parks.

Highly sensitive to assumptions about future income, vacancy rates, and expenses.

Cost Approach

A property is worth no more than what it would cost to replace it.

New construction, special-use properties (e.g., schools, data centers), or for insurance purposes.

Doesn't capture market demand or income potential well; calculating depreciation is tricky.


Each of these methods provides a critical piece of the puzzle. The real skill is knowing which one to lean on and how to blend their insights to get the full picture.


Choosing the Right Lens for the Asset


No single method is perfect for every deal. An experienced sponsor knows how to pick and choose based on the specific property and current market conditions.


For example, a stabilized, multi-tenant office building is all about the rent it collects, so the Income Approach will be your go-to. On the flip side, if you're looking at a custom-built data center with no direct "comps," you'd have to lean heavily on the Cost Approach.


Understanding these nuances is everything. To dive deeper, you can explore more advanced techniques in our guide to commercial real estate valuation methods for investors. Ultimately, the art and science of valuation is about pulling together data from all three angles to arrive at a conclusion that's logical, defensible, and truly reflects market reality.


Valuing Property Like an Appraiser Using Sales Comps


ree


Of all the real estate property valuation methods, the Sales Comparison Approach (often called the SCA or "market approach") is the most intuitive. At its core, it runs on a simple principle we all understand: a property is worth what similar properties nearby have recently sold for. It's the same logic you'd use if you were selling your house and peeked at what the neighbor’s place just went for.


In the world of commercial real estate, this method gives you a powerful, market-driven snapshot of an asset's value. An appraiser or investor will hunt down recently sold properties—known as "comparables" or "comps"—that are as close a match as possible to the building they're trying to value.


The real strength here is that this approach is grounded in reality, not just theory. It reflects the price that actual buyers and sellers have agreed on in the current market, making it an essential tool for keeping your valuation honest.


Selecting the Right Comparables


The accuracy of your entire analysis hangs on the quality of your comps. Finding a property's identical twin is next to impossible, so the real goal is to find properties that are so similar they need only minor adjustments.


Here's what to look for in a strong commercial comp:


  • Transaction Timing: The sale must be recent. Ideally, you’re looking at deals closed within the last 3-6 months. A sale from a year ago might as well be from a different era, especially in a volatile market.

  • Location: Comps must be in the same submarket or one that's demonstrably similar. You can't compare a downtown office tower to a suburban office park and expect a meaningful result.

  • Property Type & Use: Apples to apples. An office building gets compared to other office buildings. Even then, a shiny, new Class A medical facility is in a different league than an older Class C general office building.

  • Physical Characteristics: The key stats have to line up. This includes building size (square footage), age, overall condition, and the quality of construction.


The Art of Making Adjustments


Once you've gathered a handful of solid comps, the real work begins. This is where an investor's experience and judgment truly shine. You have to systematically adjust the sale price of each comp to account for every single difference between it and your property (the "subject property").


Think of it like this: if a comp is superior in some way—say, it has a brand-new HVAC system while your property’s is 15 years old—you must subtract the value of that upgrade from the comp's sale price. On the flip side, if a comp is inferior—maybe it has less desirable road frontage—you would add value to its sale price to level the playing field.


Insight Edge: Go Beyond the NumbersSeasoned investors know the story behind a sale can be more telling than the price itself. Was the seller in a tough spot and forced to offload the property below market value? Or was the buyer a strategic player willing to overpay to grab an adjacent lot? Understanding these motivations gives you a far more nuanced view of true market value than just looking at the final number on a deed. This is the kind of field intelligence a good sponsor brings to the table.

Quantifying Qualitative Differences


Some adjustments are easy math, like differences in square footage. Others are far more subjective and demand deep market knowledge. For example, how do you put a dollar value on the difference between a building with a long-term, credit-worthy tenant like a national pharmacy versus an identical, but vacant, building next door?


This is where expertise comes in. An experienced sponsor can dig into lease terms, tenant credit ratings, and local demand to assign a defensible value to that difference. This process is repeated for every major variance, for every comp, until each has been adjusted to an "as-if" price for your property. Finally, these adjusted prices are reconciled—often with a weighted average—to land on a final, confident estimate of value.


How Cash Flow Determines a Property's Worth


ree


While sales comps give you a valuable snapshot of the market, the story for income-generating assets always comes back to one thing: cash flow. This is where the Income Approach—the most critical of all real estate property valuation methods for investors—takes center stage.


The core idea is both simple and powerful: a commercial property's value is directly tied to the income it can produce. This method shifts the focus from what similar properties are selling for to what a specific property can earn.


Investors typically lean on two primary techniques to translate income into a solid valuation: Direct Capitalization and Discounted Cash Flow (DCF) analysis.


The Direct Capitalization Method


Direct Capitalization is a quick and effective way to estimate value based on a single year's income. It all hinges on a key metric known as the capitalization rate, or "cap rate," which establishes the relationship between a property's income and its price.


Think of the cap rate as the unlevered rate of return you'd expect to earn on a property in its first year of ownership. A lower cap rate implies a higher property value (and lower perceived risk), while a higher cap rate suggests a lower value (and higher perceived risk). It’s a straightforward calculation that is indispensable for initial analysis.


Novice Lens: Defining NOI & Cap Rate* Net Operating Income (NOI): This is the property's total income (from rent, fees, etc.) minus all its necessary operating expenses like property taxes, insurance, and maintenance. Importantly, NOI does not include debt service (mortgage payments), capital expenditures, or income taxes. It's the pure, unlevered profit from operations.* Capitalization Rate (Cap Rate): You calculate this by dividing the property's NOI by its market value. The formula is: Cap Rate = NOI / Property Value. To find the value, you just flip the formula: Value = NOI / Cap Rate.

For a deeper dive into the numbers, our guide on how to find Net Operating Income offers a clear walkthrough for investors.


The Discounted Cash Flow (DCF) Method


While Direct Capitalization provides a great "back-of-the-envelope" valuation, the Discounted Cash Flow (DCF) analysis offers a far more granular and forward-looking view. This method projects a property's cash flows over a longer period, typically 5 to 10 years, and then discounts them back to what they are worth in today's dollars.


A DCF model is more sophisticated because it accounts for variables that Direct Capitalization misses, like projected rent increases, changes in operating expenses over time, and the property's estimated sale price at the end of the holding period (known as the "terminal value").


For serious investors, building a robust DCF model is non-negotiable. It forces you to make detailed assumptions about:


  • Future Cash Flows: Projecting annual rent growth, vacancy rates, and expense inflation.

  • Discount Rate: Selecting an appropriate rate that reflects the investment's risk profile. A higher-risk project demands a higher discount rate, which results in a lower present value.

  • Terminal Value: Estimating the property’s sale price at the end of the projection period, often by applying an "exit cap rate" to the final year's NOI.


The real power of DCF lies in its ability to model different scenarios and stress-test your assumptions. This is where disciplined underwriting really happens.


Deal Lens Example: The Power of AssumptionsConsider a 100-unit multifamily property with a Year 1 NOI of $1,000,000.* Scenario A (Base Case): Assuming a 3% annual rent growth and an exit cap rate of 5.0% at the end of 10 years, a DCF analysis might value the property at $22.5 million.* Scenario B (Conservative): Now, let's adjust the rent growth assumption down to 2.5% and increase the exit cap rate to 5.25% (reflecting a slightly less favorable future market). Suddenly, the same property's valuation could drop to $20.8 million.That $1.7 million difference highlights a critical truth: minor tweaks to your assumptions can have a massive impact on the final valuation. This is why at Stiltsville Capital, we rigorously challenge and stress-test every assumption in our models. It ensures we are valuing properties conservatively and building in a margin of safety for our investors.

Using the Cost Approach for a Reality Check


In the often-complex world of real estate property valuation, the Cost Approach offers a fundamental, sometimes sobering, reality check. The logic behind it is refreshingly simple: why would any smart investor pay more for an existing property than it would cost to build a brand-new, equivalent one from scratch?


This method is an essential backstop, especially in hot markets where bidding wars can inflate prices far beyond what a property is physically worth. While the Income Approach tells you what a property can earn and the Sales Comparison Approach shows what others are paying, the Cost Approach grounds your valuation in the tangible reality of land and construction costs.


It becomes absolutely critical for assets where the other methods just don't work. Think about new development projects, unique properties like data centers or medical labs, or buildings in markets with few (if any) solid sales comps to go by.


Breaking Down the Components


The formula for the Cost Approach is straightforward, but each piece requires careful calculation. You’re essentially adding up the replacement cost of the building and the value of the land, then subtracting for all types of depreciation.


The final value comes down to this simple equation:


Value = Replacement Cost of Improvements + Land Value – Accumulated Depreciation

This process forces you to put on a developer's hat, breaking the asset down into its core building blocks: materials, labor, and land.


Calculating Replacement Cost


First, you have to figure out what it would cost to construct a similar building today, using current materials, building codes, and standards. This is the replacement cost, and it’s made up of two distinct types of expenses.


  • Hard Costs: These are the direct, tangible costs of construction. We're talking about everything from the steel and lumber to the plumbing fixtures, electrical wiring, and the labor needed to put it all together.

  • Soft Costs: These are the indirect but equally vital expenses. This bucket includes architectural and engineering fees, permits, legal work, financing costs, and the insurance you'd need during construction.


Add these hard and soft costs together, and you have the total replacement cost for the physical structure, also known as the "improvements."


The Three Faces of Depreciation


This is where the Cost Approach gets more nuanced. An existing building is almost never as valuable as a brand-new one. That difference in value is accounted for by subtracting depreciation, which shows up in three distinct forms.


  1. Physical Deterioration: This is the most obvious kind—the simple wear and tear a building experiences over time. A worn-out roof, an aging HVAC system, or a parking lot full of cracks are all classic examples. It’s the tangible decline of the property's condition.

  2. Functional Obsolescence: This is about features that are outdated or simply less useful by today's standards. Think of a warehouse with ceilings too low for modern racking systems, or an office building with a choppy floor plan in a market that now demands open, collaborative spaces. The design itself has lost value.

  3. External Obsolescence: This type of depreciation comes from factors completely outside the property's boundaries. It could be a new factory opening nearby that creates noise and traffic, a zoning change that hurts the area, or even a broad economic downturn in the local market that kills demand for real estate.


By meticulously calculating the replacement cost, adding the land value, and then subtracting the sum of all three types of depreciation, you arrive at a valuation grounded in physical and economic realities.


Investor Take: In a bull market, it's easy to get swept up in momentum and rosy income projections. The Cost Approach is your anchor. If a sponsor's valuation implies a price significantly above the replacement cost, you have to ask a critical question: "What justifies this premium?" It forces a disciplined conversation about market hype versus fundamental value.

Technology and Standards in Modern Valuation


ree


The bedrock principles of valuation—comparing sales, crunching income numbers, and calculating costs—are timeless. What is changing, and fast, are the tools we use and the standards that bring it all together. Technology and a globalized investment world are rewriting the playbook.


For any serious investor, understanding these forces is non-negotiable. You have to know how to separate the powerful new aids from the potential pitfalls, blending classic discipline with modern precision to get to an institutional-grade valuation.


The Rise of Valuation Technology


Technology isn't just a nice-to-have in real estate anymore; it's right at the center of how we analyze properties. Think of Automated Valuation Models (AVMs) and AI platforms that can churn through massive datasets in the blink of an eye, spotting market trends and pulling comps faster than any human ever could.


This brings some huge advantages to the table for investors:


  • Speed and Efficiency: Initial deal screening moves at light speed. This lets your team zero in on the most promising opportunities instead of getting bogged down in the early stages.

  • Data Aggregation: Modern platforms pull in data from countless sources, giving you a bird's-eye view of a market that can sharpen your underwriting assumptions.

  • Pattern Recognition: AI is great at spotting subtle connections you might miss—things like how foot traffic patterns or small demographic shifts correlate with rental growth.


But it's crucial to remember that these tools have their limits, especially when you’re dealing with the unique complexities of commercial real estate.


Investor Take: Technology is a powerful co-pilot, but it's not the pilot. An AVM can't walk a property, see the functional obsolescence with its own eyes, or understand the story behind a motivated seller. It can’t gauge the quality of a tenant roster. Tech gives you the "what," but it takes an expert's judgment to understand the "why"—and that distinction is everything in disciplined underwriting.

Global Standards for Investor Confidence


As capital flows more freely across borders, a common language for valuation is essential. An investor in Singapore needs to know that a property valuation in Florida was done with the same rigor as one in their own backyard. That's where global standards come in.


The move toward standardization in real estate valuation began in earnest in the 1980s. The creation of the International Valuation Standards Committee (IVSC) in 1981 was a huge step, giving us a consistent framework for valuations all over the world.


This harmony is vital. It boosts confidence for cross-border deals and keeps everything transparent for regulators. The market for these valuation services is already substantial, hitting an estimated $6.5 billion in 2023 and projected to nearly double by 2032, according to Fortune Business Insights (as of Q4 2023). You can dig into the full research about the real estate valuation service market growth for a deeper look.


For family offices and high-net-worth individuals looking at global opportunities, this is a critical checkpoint. When you see a sponsor adhering to globally recognized standards, it’s a powerful signal of their professionalism and reliability. It builds a baseline of trust and ensures their reports are comparable, transparent, and defensible, no matter where in the world the asset is.


Your Due Diligence Checklist for Property Valuation


Understanding the theory behind real estate property valuation methods is one thing; stress-testing a sponsor’s numbers is something else entirely. At the end of the day, a valuation is only as strong as the assumptions it’s built on. This checklist gives you the critical questions to ask any sponsor, designed to pressure-test their underwriting and reveal the true quality of their analysis.


Transparent, institutional-grade partners welcome these kinds of questions. They see them not as a challenge, but as an opportunity to demonstrate the rigor behind their work.


Key Questions for Sponsor Diligence


Arm yourself with these prompts before your next investment call. The quality of the answers will tell you everything you need to know about a sponsor's approach to risk management and value creation. A comprehensive approach is a key part of the real estate due diligence process, ensuring no stone is left unturned. For a complete overview, explore our guide to commercial real estate due diligence.


  • Valuation Weighting: Which valuation method did you lean on most for this asset, and what was your specific reason for doing so?

  • Income Assumptions: What are your core assumptions for rent growth, vacancy rates, and expense inflation over the hold period? How do these stack up against the submarket's historical performance?

  • Exit Assumptions: What exit cap rate are you projecting, and how exactly did you arrive at that number? How does it compare to where similar assets are trading today?

  • Comparable Adjustments: Can you walk me through the specific adjustments you made to your top three sales comps? I want to understand the logic.

  • Downside Scenarios: What happens to your valuation if key assumptions don't materialize? Have you modeled for higher interest rates, slower rent growth, or a higher exit cap rate?


Risk & Mitigation in Property Valuation


Every valuation carries risk. The difference between an amateur and a professional is the ability to identify those risks upfront and have a clear plan to mitigate them. Experienced sponsors have a playbook for shoring up the common weak spots in their analysis.


Here’s a look at how they think about it.


  • RISK: Overly Optimistic Projections * MITIGATION: Underwriting is based on trailing historical performance and conservative, third-party market forecasts—not "pro-forma" or speculative numbers.

  • RISK: Poor Comparable Selection * MITIGATION: Using a tight geographic radius and recent sales (ideally <6 months); adjusting for any motivational factors like a distressed seller.

  • RISK: Ignoring Capital Expenditures * MITIGATION: Factoring in a robust capital reserve budget for both predictable replacements (like an HVAC system) and any unforeseen issues.

  • RISK: Market Condition Shifts * MITIGATION: Running a sensitivity analysis to model the impact of interest rate hikes, increased vacancy, or cap rate expansion on the final valuation.


Anticipating these issues isn't just good practice; it's the foundation of a sound, resilient investment strategy. It ensures the valuation is grounded in reality, not just wishful thinking.


Common Questions on Property Valuation


Even after you get the hang of the big three real estate property valuation methods, questions always pop up when you try to apply them to the real world. Let's tackle some of the most common ones we hear from investors, connecting these core ideas to actual deal-making.


How Often Should We Re-Value a Commercial Property?


The real answer? It depends on the purpose. For a serious institutional asset manager, a property's value is always being monitored.


  • Formal Third-Party Appraisals are the big ones. Lenders will require these when you’re buying a property or refinancing debt, typically every 3-5 years. They’re also a must-have if you’re thinking about selling. This provides an official, defensible number.

  • Internal Quarterly Valuations are what savvy investment sponsors do to stay on top of their game. They’re constantly checking performance against their initial projections, using fresh market data—like recent sales and leasing comps—to "mark the asset to market." This isn't just paperwork; it allows for dynamic strategy adjustments.


What's the Best Valuation Method for Multifamily Properties?


When it comes to apartment buildings, the Income Approach is king. No question. Investors buy these assets for one primary reason: the consistent cash flow they produce. That means a property's value is tied directly to its Net Operating Income (NOI).


The Direct Capitalization (cap rate) method gives you a quick, powerful snapshot of where the market is today. For a deep-dive underwriting, a detailed Discounted Cash Flow (DCF) analysis is non-negotiable.


But don't ignore the other methods. They provide crucial backup. The Sales Comparison Approach keeps you honest, checking your income-based value against what similar buildings have actually sold for. And the Cost Approach sets a logical ceiling—why pay more for an existing building than it would cost to build a brand new one next door?


Investor Take: A sophisticated sponsor will always show their work, backing up their valuation with all three methods. If they lean on just one without a solid reason, it could be a red flag that their underwriting isn't as thorough as it should be.

How Do Interest Rate Changes Hit Property Values?


Interest rates have a huge, direct impact on commercial property values, and it all comes down to their effect on capitalization rates. There’s an inverse relationship between interest rates and property values.


Here's how it works on the ground:


  1. When the Federal Reserve raises interest rates, mortgages get more expensive for real estate investors.

  2. To hit their target returns, buyers now have to pay less for the property to make up for those higher borrowing costs.

  3. This market pressure forces cap rates to go up (investors call this "cap rate expansion"). Since the formula is Value = NOI / Cap Rate, a higher cap rate pushes the property's value down.


The reverse is also true. When interest rates fall, borrowing is cheaper, cap rates tend to compress, and property values climb. This is exactly why a sponsor's assumptions about future interest rates and exit cap rates are two of the most critical things to scrutinize in any deal.


At Stiltsville Capital, we combine a disciplined, multi-faceted valuation process with a forward-looking view of the market. This helps us find opportunities with a clear margin of safety, ensuring that well-structured real assets can be a prudent, resilient component of your long-term wealth strategy.


Want to see how our rigorous approach can fit into your portfolio? Schedule a confidential call with our team.


Information presented is for educational purposes only and does not constitute an offer to sell or a solicitation of an offer to buy securities. Any offering is made only through definitive offering documents (e.g., private placement memorandum, subscription agreement) and is available solely to investors who meet applicable suitability standards, including “Accredited Investor” status under Rule 501 of Regulation D. Investments in private real estate involve risk, including loss of capital, illiquidity, and no guarantee of distributions. Past performance is not indicative of future results. Verification of accredited status is required for participation in Rule 506(c) offerings.


Reading Time: 8 min | Good for: Novice Investors (A), Family Offices (B)


TL;DR: The Bottom Line on Cash Flow Real Estate


  • Cash flow is king. It's the net profit left after all expenses and mortgage payments are made, providing a reliable income stream and a buffer against market downturns.

  • Metrics matter. Net Operating Income (NOI), Cash-on-Cash Return, and Debt Service Coverage Ratio (DSCR) are the core metrics that reveal a property's true financial health and its appeal to lenders.

  • Today's market favors cash flow. With new construction slowing, particularly in multifamily housing, existing properties are well-positioned for strong rental demand and occupancy, directly boosting income potential.

  • Maximizing returns is an active process. The best operators increase cash flow by both driving revenue (strategic upgrades, ancillary income) and cutting expenses (tax appeals, energy efficiency).

  • The next step. For accredited investors, understanding these principles is the first step toward building a resilient portfolio. The next is finding a sponsor who lives by them.


At its core, cash flow real estate is simple: it’s an investment property that brings in more money from rent than it costs you to own and operate. That difference is your net profit, and it's the tangible, spendable proof that your asset is truly working for you. Think of it as the financial heartbeat of a healthy real estate portfolio.


The Foundation of Durable Wealth


ree


For sophisticated investors and family offices, chasing cash flow isn't just a strategy—it's the foundation for building durable, long-term wealth. Unlike market appreciation, which is the unpredictable rise in a property's value, cash flow isn’t speculative. It's a reliable, consistent income stream that delivers immediate returns while acting as a powerful buffer against economic swings.


While the thrill of a big sale is hard to deny, disciplined investors know that appreciation is the bonus, not the main event. Consistent positive cash flow is the engine that keeps a portfolio running. It lets you cover all your expenses, build up reserves for the next great opportunity, and take distributions without ever being forced to sell.


Why Cash Flow Is a Critical Metric


If you want to understand the true health of a real estate investment, you have to look at its cash flow. It cuts through all the market noise and gives you a clear, unvarnished picture of how the asset is actually performing.


  • Financial Stability: Positive cash flow means the property pays for itself. The mortgage, taxes, insurance, and maintenance are all covered without you ever needing to reach into your own pocket.

  • Risk Mitigation: When the economy takes a downturn and property values flatten out or even dip, a cash-flowing asset keeps generating income. That's what protects your investment from distress.

  • Proof of Concept: It proves you made the right call. When a property generates positive cash flow, it’s confirmation that your analysis of rents, expenses, and market demand was spot-on.


The Current Market Advantage


In today's economic climate, focusing on cash flow has become more important than ever. The current market dynamics are creating compelling openings for investors who prioritize income-producing assets.


Market Signal Box (Data as of Q1 2024) The Data: Projections for 2024 show a stunning 30% year-over-year drop in new multifamily housing deliveries, according to data from RealPage. This slowdown in construction, driven by higher financing costs and economic uncertainty, is creating a supply crunch in many markets. Investor Take: With less new competition, well-located existing properties can command strong rents and maintain high occupancy. This supply-demand imbalance is a direct driver of robust, reliable cash flow for disciplined investors. You can read more about the new economy of real estate investing.

How to Calculate Real Estate Cash Flow


Moving from an idea to a spreadsheet is where a deal's true potential—or its hidden flaws—comes to light. Mastering the math behind cash flow real estate is non-negotiable for any serious investor. It's how you transform abstract opportunities into concrete financial projections.


The process is essentially a logical waterfall. You start with the absolute most a property could earn, and then you systematically subtract the real-world costs to land on that final, all-important number: the cash in your pocket.


This diagram shows the three core stages, walking you from top-line income down to your net cash flow.


ree


As you can see, each step sharpens the financial picture by factoring in the realities of owning and operating a property. Let's break down each stage with a practical example.


The Cash Flow Waterfall Step-by-Step


Think of calculating cash flow as a simple subtraction problem with a few key milestones. It all begins with what the property could make in a perfect world, then gets real by deducting the actual costs of running it.


  1. Start with Gross Potential Income (GPI): This is the maximum rental income your property could generate if every single unit were rented for the entire year at the full market rate. It's your ceiling.

  2. Account for Vacancy and Credit Loss: Reality check—no property stays 100% occupied forever. This line item accounts for the inevitable gaps when units are empty between tenants or when someone fails to pay. A standard assumption is often 5-10% of GPI.

  3. Determine Effective Gross Income (EGI): Subtract those vacancy losses from your GPI. Then, add any other miscellaneous income (think parking fees, laundry machines, or pet fees). This gives you the EGI, a much more realistic picture of your annual revenue.

  4. Subtract Operating Expenses (OpEx): These are the unavoidable, day-to-day costs of keeping the lights on and the property running. This includes property taxes, insurance, management fees, utilities, and routine maintenance.

  5. Calculate Net Operating Income (NOI): EGI minus OpEx equals your NOI. This is a critical metric because it shows you the property's raw profitability before you factor in any loan payments.

  6. Deduct Debt Service: This is simply your total mortgage payment for the year (which includes both principal and interest).

  7. Arrive at Net Cash Flow: NOI minus Debt Service is your final Net Cash Flow. This is the money that actually hits your bank account. It’s the profit.


An Example: A 10-Unit Multifamily Property


To make this tangible, let’s run the numbers for a hypothetical 10-unit apartment building where each unit rents for $1,500 per month. Here's how the waterfall calculation plays out, turning our assumptions into a clear financial snapshot.


Illustrative Cash Flow Calculation for a 10-Unit Multifamily Property


Metric

Calculation/Note

Annual Amount

Gross Potential Income (GPI)

10 units x $1,500/mo x 12 months

$180,000

Less: Vacancy Loss

5% of GPI, a typical market assumption

($9,000)

Effective Gross Income (EGI)

GPI - Vacancy Loss

$171,000

Less: Operating Expenses (OpEx)

Assumed at 40% of EGI (taxes, insurance, etc.)

($68,400)

Net Operating Income (NOI)

EGI - OpEx

$102,600

Less: Debt Service

Annual mortgage payments on the loan

($72,000)

Net Cash Flow (Before Taxes)

NOI - Debt Service

$30,600


In this scenario, after all the bills and the mortgage are paid, the property generates $30,600 in positive cash flow for the year. This is the income that provides returns to investors and fuels long-term wealth creation.


Novice Lens: Net Cash Flow is your take-home pay from the property. It's the simplest measure of whether your investment is making money or costing you money each month.

Advanced Metrics Sophisticated Investors Use


While Net Cash Flow is the end goal, institutional investors and lenders look deeper to truly understand a deal's strength and risk profile.


Advanced Lens: For sophisticated investors, metrics like DSCR and Cash-on-Cash Return are not just numbers; they are the language of institutional finance. They determine if a bank will even consider your loan application and how your deal stacks up against competing investment opportunities.
  • Debt Service Coverage Ratio (DSCR): This is calculated as NOI / Debt Service. Lenders use it to measure a property's ability to comfortably cover its mortgage payments. In our example, the DSCR is $102,600 / $72,000 = 1.43x. Most lenders require a DSCR of 1.25x or higher, so at 1.43x, this property would be considered a strong candidate for financing.

  • Cash-on-Cash (CoC) Return: This metric measures the annual cash flow relative to the total cash you invested out-of-pocket. If the down payment and closing costs for our example property totaled $400,000, the CoC return would be $30,600 / $400,000 = 7.65%. It gives you a crystal-clear picture of the return on your invested capital for that year.


Finding and Analyzing High Cash Flow Properties


ree


Spotting properties with real income potential isn't about luck. It's a disciplined process that starts with the big picture—the market—and drills down to the nitty-gritty details of the asset itself.


Success in cash flow real estate starts by zeroing in on markets with strong fundamentals. This top-down view helps you put your capital to work where demographic and economic tailwinds can support rental demand for the long haul. Once you’ve found a promising submarket, the focus shifts to the property.


Conducting Thorough Market Analysis


Before you glance at a single property listing, you need to understand the market's health. We hunt for key signals of a thriving, resilient local economy.


Here are the big-picture indicators we look for:


  • A Diverse Job Market: We target areas with a healthy mix of employers in stable sectors like healthcare, technology, education, and logistics, avoiding dependence on a single industry.

  • Population Growth: A steady stream of new residents is one of the most powerful signs of a market’s appeal and future housing demand.

  • Favorable Price-to-Rent Ratios: In markets where buying is expensive relative to renting, you'll find a much larger and more stable pool of long-term renters.


Focusing on Property-Specific Traits


Once you’ve locked in on a target market, it’s time to evaluate individual assets. This is where underwriting discipline shines.


You have to look for these essential characteristics:


  • Location: Is it close to job centers, good transportation, and amenities people want, like schools and shops? Location drives demand.

  • Condition: Is the property in good shape, or is it a money pit waiting to happen? Deferred maintenance can demolish your cash flow.

  • Unit Mix: A smart mix of one, two, and three-bedroom units opens the door to a wider range of tenants, from young professionals to small families, keeping vacancy risk low.


Investor Takeaway: A B-class property in an A-grade location will almost always outperform an A-class property in a C-grade location over the long term. Why? Because location drives demand, and demand supports rents and occupancy—the two levers that control your cash flow.

Questions to Ask a Sponsor: Your Due Diligence Checklist


Analyzing a potential deal is all about asking the right questions. This is how you protect your capital and uncover an asset's true potential.


Here are the essential questions you should be asking any sponsor:


  1. How do the projected operating expenses compare to market averages for similar properties?

  2. What is the gap between current in-place rents and achievable market rents?

  3. What has the property’s occupancy rate been over the last 3-5 years, and what were the drivers?

  4. What is the specific, actionable plan to add value and increase the Net Operating Income?

  5. What are the terms of any existing or proposed debt on the property?

  6. How much is budgeted for immediate repairs and future capital improvements, and is it sufficient?


A sponsor who can give you clear, data-backed answers to these questions is showing their expertise and transparency. For a deeper look into our own process, review our firm's detailed acquisitions criteria.


Proven Strategies to Maximize Your Cash Flow


A great property is just the starting point. Actively creating superior returns requires a proactive, two-pronged approach: boost revenue and trim expenses. Disciplined investors do both, relentlessly hunting for operational wins that make a huge impact on the bottom line of their cash flow real estate portfolio.


ree


Driving Revenue Growth


This goes way beyond just hiking rents. It's about a creative, strategic mindset—a hunt for the hidden value already inside the property.


  • Strategic Unit Upgrades: This is the classic "value-add" play. By investing in smart renovations—think modernizing kitchens, adding in-unit laundry, or installing smart-home tech—you can justify significant rent bumps that deliver a fantastic return on capital.

  • Adding Ancillary Income Streams: Look around the property. Are there underused spaces or services you can monetize? This could be anything from adding reserved parking spots and tenant storage units to leasing roof space for a cell tower. These small, recurring revenues add up.


Reducing Operating Expenses


On the other side of the ledger, cutting costs can be just as potent as raising revenue. Every dollar saved on expenses is a pure dollar of profit that drops straight to the bottom line.


  • Proactively Appeal Property Taxes: Your property tax assessment isn't written in stone. A successful appeal can be one of the single biggest expense cuts you'll ever make.

  • Negotiate Vendor Contracts: Don't just let contracts for landscaping, trash removal, or insurance auto-renew. Regularly putting these services out to bid ensures you're getting competitive prices without sacrificing quality.

  • Implement Energy-Efficient Systems: Upgrading to LED lighting, installing low-flow water fixtures, or investing in a modern HVAC system doesn't just slash utility costs. It also polishes the property's ESG profile, making it more attractive to tenants and future buyers.


Deal Lens Example: The Workforce Housing Turnaround


To see how this works, let's walk through a simplified case study of a 100-unit workforce housing asset we might target with a value-add strategy.


The Situation: A property with dated units and inefficient management. Rents were below market, and utility bills were too high. The mission was to boost the Net Operating Income (NOI) with targeted operational fixes.


The Action Plan:


  1. Renovation: We executed a rolling renovation on 30% of the units, focusing on kitchens and bathrooms. This justified a $150/month rent premium on each upgraded unit.

  2. Ancillary Income: We created a paid parking program for 50 premium spots, charging $50/month.

  3. Expense Reduction: We swapped to a more efficient utility billing system and installed water-saving fixtures, cutting water and sewer costs by 12%.


The Impact: The renovations and new parking fees boosted annual revenue by $84,000, while our efficiency push cut expenses by $30,000. The result was a $114,000 increase in NOI—a 15% lift in just two years, creating substantial value. For a deeper dive, explore our investment insights.


Risk & Mitigation: Protecting Your Cash Flow


Every seasoned investor knows that preparing for the downside is just as important as planning for the upside. A smart strategy doesn't just hope for the best; it builds a fortress around your cash flow to protect it.


Key Cash Flow Risks and Mitigation Strategies


  • Risk: Unexpected Vacancies * An empty unit is a direct hit to your gross income, shrinking your Net Operating Income (NOI). * Mitigation: Maintain a dedicated capital reserve fund to cover income gaps. Implement proactive tenant retention programs to keep good tenants happy and reduce turnover.

  • Risk: Major Capital Repairs * A sudden major expense (e.g., a new roof, HVAC system) can wipe out months of cash flow. * Mitigation: A thorough Property Condition Assessment (PCA) pre-acquisition identifies future needs. A portion of monthly income is systematically set aside into a capital reserve account to fund these repairs without impacting investor distributions.

  • Risk: Tenant Defaults * Non-payment means an immediate loss of income, compounded by the legal costs of eviction. * Mitigation: A rock-solid tenant screening process is the first line of defense (credit checks, income verification). In larger properties, a diverse tenant base spreads this risk out.

  • Risk: Rising Interest Rates * Higher rates increase the cost of debt, squeezing the cash flow available for distribution. * Mitigation: Secure long-term, fixed-rate debt whenever possible to lock in costs. For variable-rate loans, purchase interest rate caps to limit exposure.


Final Thoughts: The Resilient Power of Cash Flow


Investing in cash flow real estate is more than a financial transaction; it's a commitment to a disciplined, long-term strategy for wealth preservation and growth. While market trends will come and go, the fundamental value of a well-located, professionally managed asset that generates consistent income remains a constant. For many family offices and high-net-worth investors, allocations to private real estate, as noted in recent reports by firms like UBS, continue to be a cornerstone of a diversified portfolio aimed at hedging inflation and generating reliable returns. You can read more about global real estate investment trends here.


Well-structured real assets can be a prudent, resilient component of your long-term wealth strategy. By focusing on strong fundamentals, disciplined underwriting, and active management, investors can navigate economic cycles with confidence.


Next Steps for Accredited Investors


At Stiltsville Capital, our entire focus is on finding and managing institutional-quality assets that deliver steady, risk-adjusted returns. If you're an accredited investor looking to see how a disciplined real estate approach could strengthen your portfolio, we invite you to connect with us.


Disclaimer: Information presented is for educational purposes only and does not constitute an offer to sell or a solicitation of an offer to buy securities. Any offering is made only through definitive offering documents (e.g., private placement memorandum, subscription agreement) and is available solely to investors who meet applicable suitability standards, including “Accredited Investor” status under Rule 501 of Regulation D. Investments in private real estate involve risk, including loss of capital, illiquidity, and no guarantee of distributions. Past performance is not indicative of future results.


Corporate Office

30 West Mashta Drive | Suite 400

Key Biscayne, FL 33149​​

Tel: 786.316.9840

© 2025 Stiltsville Capital LLC

Stiltsville Capital LLC_logo_black

Disclosures

​​​Success Stories and Testimonials are intended to demonstrate our firms professional experience and history of providing exceptional service to their clients and reflect the collective experience of Stiltsville Capital, LLC's Principals and Team members and may include transactions/clients they have worked with directly at previous firms.

Stiltsville Capital, LLC and its affiliates do not provide tax or legal advice. Information contained on this website is provided for educational and illustrative purposes only and cannot be relied upon to avoid tax penalties. Please consult your tax and legal advisors to determine how this information may apply to your own situation. Whether any planned tax result is realized by you depends on the specific facts of your own situation at the time your tax return is filed. 


Real estate and private equity investments have special risks, including possible illiquidity of the underlying properties, credit risk, interest rate fluctuations, and the impact of varied economic conditions and may not be suitable for all investors.

bottom of page