How to Calculate Cap Rate for Real Estate: The Definitive Investor Guide
- Ryan McDowell

- Aug 20, 2025
- 13 min read
Reading Time: 7 min | Good for: Novice (A), Informed (B), Sophisticated (C)
When evaluating commercial real estate, few metrics are as essential as the capitalization rate, or "cap rate." It's the back-of-the-napkin calculation every serious investor masters. This guide will show you how to calculate cap rate, interpret it like a professional, and use it to make smarter investment decisions.
TL;DR: Cap Rate Essentials
What it is: Cap rate is a property's unlevered annual return, calculated as Net Operating Income (NOI) / Property Value.
Why it matters: It provides a clean, apples-to-apples way to compare the raw income potential of different properties before considering debt.
How to use it: A low cap rate typically signals a stable, lower-risk asset in a prime market, while a high cap rate suggests higher potential returns but also greater risk.
Next step: Mastering the cap rate is the first step toward disciplined underwriting. The key is to scrutinize the inputs—especially the NOI—to ensure the metric is based on reality, not fantasy.
Calculating Cap Rate: A Quick Investor Guide

For a busy investor, the cap rate is your first-pass filter. It cuts through the noise of complex financing to reveal a property's raw, income-generating potential relative to its price. A higher cap rate often signals a higher potential return, but it might also hint at greater risk. Conversely, a lower cap rate usually points to a more stable, lower-risk asset—often with a premium price tag to match.
Think of it this way: a property generating a Net Operating Income (NOI) of $500,000 with a market value of $5,000,000 has a 10% cap rate. This calculation deliberately ignores financing costs like your mortgage because the goal is to evaluate the asset on its own merits. It’s all about the property's intrinsic ability to produce income.
Deconstructing the Formula
To truly understand cap rates, you must master the two components that drive the calculation. Each one tells a crucial part of the investment story.
Net Operating Income (NOI): This is the engine of your return. It’s all the revenue a property generates (from rent, fees, etc.) minus all necessary operating expenses. Think property taxes, insurance, and maintenance—but not your loan payments. NOI is a pure measure of a property's profitability from its day-to-day operations.
Property Value: This is either the price you paid for the asset or its current market value. Using the purchase price gives you your "going-in" cap rate, which locks in your initial yield. Using the current market value helps you understand how that yield compares in today's climate.
If you want to go deeper into the mechanics, you might find our guide on the capitalization rate formula for real estate investors helpful.
Investor Take: Think of the cap rate as a snapshot of performance. It's not the whole movie—it won't tell you about future rent growth or the powerful impact of leverage—but it provides an essential baseline for your initial due diligence. Getting this calculation right is the first step toward disciplined underwriting.
Cap Rate Formula Components at a Glance
To make this even clearer, here's a quick reference table breaking down each component. It's a handy cheat sheet for understanding how each piece of the puzzle fits into your analysis.
Component | Definition | What It Tells an Investor |
|---|---|---|
Net Operating Income (NOI) | Gross rental income plus other revenue, minus all operating expenses (taxes, insurance, maintenance). | The property's pure, unlevered profitability from operations before debt service or major capital projects. |
Property Value / Price | The acquisition cost of the property or its current appraised market value. | The capital base against which the property's income is measured; it’s the denominator in your return calculation. |
Capitalization Rate (Cap Rate) | The resulting percentage when NOI is divided by Property Value. | The unlevered annual rate of return, giving you a standardized metric to quickly compare different investment opportunities. |
Mastering these components is fundamental. Once you do, you'll be able to size up deals faster and make smarter, more confident investment decisions.
Mastering Net Operating Income for Accurate Valuations
A cap rate is only as good as the numbers you plug into it. The entire calculation hinges on one critical figure: Net Operating Income (NOI).
Think of NOI as a property’s pure, unadulterated profit before any financing enters the picture. It’s the key metric that lets you make a true apples-to-apples comparison between potential deals. To calculate it, you must work from the top down, starting with a property’s total potential income and methodically subtracting all legitimate costs.
Starting with Gross Income
First, you need to identify all potential income streams. This journey begins with Gross Potential Rent (GPR), which is the absolute maximum rent you could collect if every single unit was leased at full market rates for the entire year.
But no property ever stays 100% occupied. You have to account for the real world by subtracting an allowance for vacancy and credit loss (for tenants who don't pay). What you're left with is the Effective Gross Income (EGI), a much more honest picture of your likely annual revenue.
Novice Lens: Why This MattersNever just take a seller's vacancy rate at face value. Always cross-reference it with market data for similar properties in that specific submarket. A 2% vacancy sounds fantastic, but if the market average is actually 7%, you need to underwrite your deal using the more conservative number.
Deducting the Right Operating Expenses
Once you have your EGI, it’s time to subtract the Operating Expenses (OpEx). These are all the day-to-day costs required to keep the property running and the rent checks coming in.
Legitimate operating expenses almost always include:
Property Taxes: A non-negotiable annual cost.
Insurance: Covering hazard, liability, and other property-specific risks.
Utilities: Any costs not passed through directly to tenants, like common area electricity.
Property Management Fees: Typically a percentage of the rent you actually collect.
Repairs & Maintenance: Routine upkeep for plumbing, HVAC, landscaping, and the like.
Administrative & Marketing Costs: Expenses for leasing, advertising, and office supplies.
Let's say a property pulls in $1,000,000 in potential rent. You factor in $50,000 for vacancy and then subtract $300,000 in operating expenses. That gives you an NOI of $650,000. If the property is valued at $6,500,000, dividing the NOI by the value gives you a 10% cap rate. You can play around with these numbers yourself with a helpful cap rate calculator.
What You Must Exclude from NOI
This is where many new investors trip up. Certain expenses, while very real out-of-pocket costs, are deliberately excluded from the NOI calculation to keep it a standardized, comparable metric.
Do NOT include these items when calculating NOI:
Debt Service: Your principal and interest payments on the loan. NOI is a pre-debt metric, period.
Capital Expenditures (CapEx): Major, one-off improvements that extend the life of the asset, like a brand new roof or a full HVAC system replacement. These are considered "below-the-line" costs.
Tenant Improvements (TIs): The money you spend to customize a space for a new commercial tenant.
Leasing Commissions: The fees you pay to brokers for landing you a new tenant.
Depreciation: This is a non-cash expense for accounting and tax purposes only.
Excluding these items is vital. It isolates the property's raw operational performance, which is the true core of its value and a fundamental piece of nearly all top commercial real estate valuation methods. Mastering this distinction is non-negotiable for disciplined and successful underwriting.
A Real-World Cap Rate Calculation Example
Formulas are one thing, but seeing them in action on a live deal is where the concept truly clicks. Let's walk through an illustrative scenario to calculate a property's cap rate, using a value-add medical office building as our example. This isn't just about a static number; it’s about seeing how the metric evolves as an investment plan is executed.
Imagine we are evaluating a well-located but tired medical office building with a $10,000,000 price tag. The property is generating income, but we see a clear path to boost its value through smart renovations and proactive management.
Calculating The "Going-In" Cap Rate
First, we need a baseline. That’s the “going-in” cap rate. This is the cap rate at the moment of purchase, based on how the property is performing right now. It establishes our unlevered yield on day one.
Here’s the current annual financial snapshot:
Gross Potential Rent: $850,000
Vacancy & Credit Loss (5%): -$42,500
Effective Gross Income (EGI): $807,500
Total Operating Expenses (Taxes, Insurance, Maint.): -$257,500
This leaves us with a Net Operating Income (NOI) of $550,000.
Now, we plug that into our simple formula:
Cap Rate = NOI / Purchase Price
Cap Rate = $550,000 / $10,000,000 = 5.5%
So, our going-in cap rate is 5.5%. This initial yield reflects the building's current, un-optimized state and gives us our starting point.
Projecting The "Stabilized" Cap Rate
A value-add strategy is all about creating future value. Our business plan calls for a $1,000,000 investment in capital improvements—modernizing the lobby, upgrading tenant suites, and improving energy efficiency. We project that over the next couple of years, these upgrades will attract higher-quality tenants at higher rents, while also reducing operating costs.
This is the basic flow for figuring out Net Operating Income, which is the heart of any cap rate analysis.
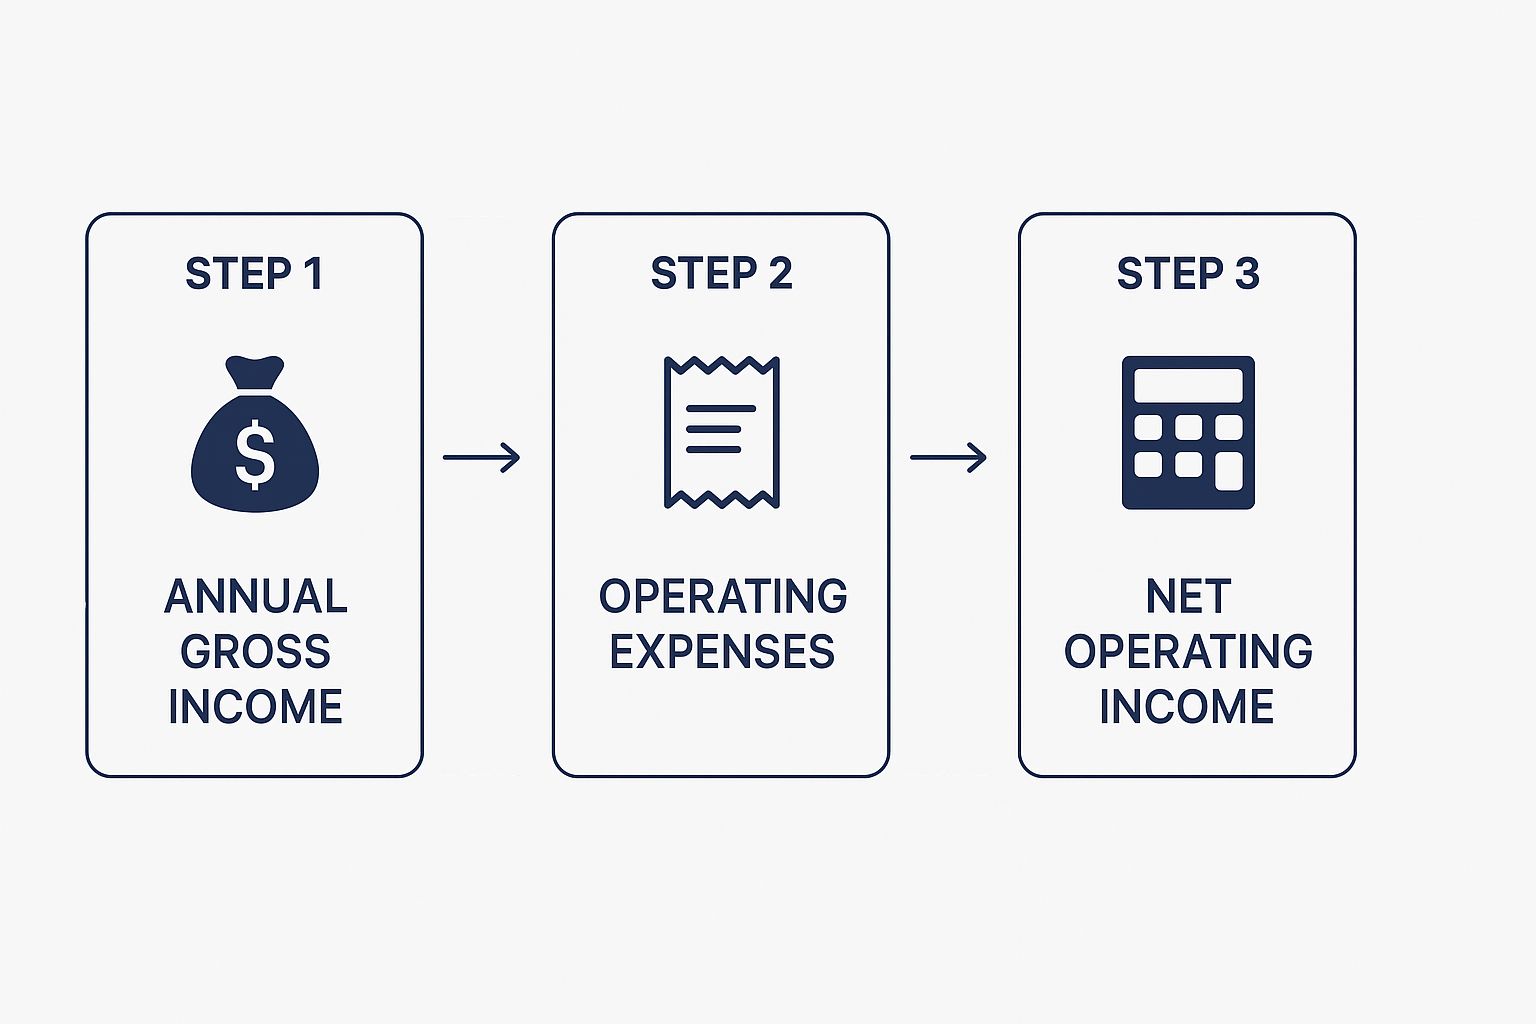
As you can see, you start with the total potential income and then subtract all the real-world vacancies and expenses to arrive at the final profit figure.
Now let's project the financials for Year 3, once the property is renovated and re-leased—what we call “stabilized.”
Gross Potential Rent: $1,050,000
Vacancy & Credit Loss (now just 4%): -$42,000
Effective Gross Income (EGI): $1,008,000
Total Operating Expenses (more efficient): -$288,000
Our new, stabilized NOI is now $720,000. If we calculate the cap rate based on our total investment ($10M purchase + $1M in CapEx = $11M), we arrive at a stabilized cap rate on cost of 6.55%.
The table below breaks down this "before and after" snapshot, showing how our work directly impacts the numbers.
Illustrative Deal Lens: Medical Office Building
Metric | As-Is (Year 1) | Stabilized (Year 3) | Notes |
|---|---|---|---|
Purchase Price | $10,000,000 | N/A | Initial acquisition cost. |
Capital Expenditures | N/A | $1,000,000 | Renovation budget to modernize the asset. |
Total Cost Basis | $10,000,000 | $11,000,000 | Total capital invested in the deal. |
Net Operating Income (NOI) | $550,000 | $720,000 | NOI increases due to higher rents and efficiencies. |
Cap Rate on Cost | 5.50% | 6.55% | Calculated on Total Cost Basis for Year 3. |
Seeing the numbers side-by-side makes the story clear: our strategic investment and hands-on management create a more valuable, higher-performing asset.
Sophisticated Lens: The "Yield on Cost" SpreadThe spread between the 5.5% going-in cap rate and the 6.55% stabilized yield on cost is where value is created. It is the direct financial result of executing the business plan, quantifying how active management and smart capital can dramatically improve a property’s return profile. This "development spread" is the core of any successful value-add investment.
How to Interpret Cap Rates in Today's Market
Calculating a cap rate is simple math. Interpreting what that number means is an art. There’s no universally “good” cap rate—it all depends on context.
A 4.5% cap rate might be an excellent return for a brand-new data center in a core market like Northern Virginia. But a 9% cap rate on a struggling retail strip in a tertiary market could be a major red flag. The number is a snapshot of risk, growth potential, and market sentiment, all rolled into one percentage.
The Trade-Off: Risk vs. Return
Think of the cap rate as a barometer for risk. The relationship is inverse: the lower the perceived risk, the lower the cap rate, and vice versa. Investors are always willing to pay more—and accept a lower initial return—for assets they believe are safe bets.
Here’s a simple way to look at it:
Low Cap Rate (e.g., 4-5.5%): This usually points to a high-quality, stable asset in a fantastic location. Picture a new apartment building in a major city, fully leased to reliable tenants. The risk of things going sideways is minimal, so the return is naturally lower.
High Cap Rate (e.g., 8-10%+): This signals a property with more risk. It might be an older building in a secondary market, a property with significant vacancy, or an asset class facing economic headwinds. That higher potential return is your compensation for taking on the extra risk.
What’s Really Driving the Number?
A cap rate isn't set in a vacuum. It’s the result of several powerful forces all pulling in different directions.
Property Type and Class
Every asset class has its own risk profile. A medical office building anchored by a major hospital system is a world away from a hotel that relies on seasonal tourists.
Multifamily & Industrial: Often trade at lower cap rates because demand is consistently strong.
Hospitality & Specialty Retail: You’ll typically see higher cap rates here to compensate for the hands-on management and sensitivity to economic shifts.
Location, Location, Location
A property in a booming Sunbelt city will command a much lower cap rate than one in a small town with a shrinking population. Proximity to economic engines—ports, universities, major employers—is a massive de-risking factor.
Broader Economic Conditions
Cap rates move with the wider economy. Interest rates, inflation expectations, and GDP growth all have a huge impact. According to CBRE research (as of Q4 2023), cap rates for U.S. commercial real estate have been rising across most sectors as a response to higher interest rates, reflecting a repricing of risk in the market. For a deeper dive into this, you can explore detailed analyses of cap rates and real estate cycles.
Investor Take: Don't just chase the highest number. Interpreting a cap rate is about asking one simple question: "Does this return fairly compensate me for the risks I'm taking on?" A smart investor uses market cap rates as a benchmark to make sure a deal's pricing is grounded in reality.
Advanced Strategies: Avoiding Common Cap Rate Mistakes
Once you’ve got the basic formula down, calculating cap rates becomes less about math and more about disciplined underwriting. This is where novice investors often get tripped up, making predictable mistakes that lead to a flawed analysis.
The most common trap? Blindly trusting the seller’s pro-forma financials. A pro-forma is a projection—a best-case scenario of what a property could earn. It's not historical fact. More often than not, it paints a rosy picture, assuming aggressive rent hikes that the local market simply can't sustain.
Another frequent misstep is failing to normalize operating expenses. You can't just take two properties' expense reports at face value. One owner might be running a tight ship, while another is deferring critical maintenance. For a true apples-to-apples comparison, you must adjust the expenses to reflect a realistic, sustainable operating budget for each property.
Going-In vs. Exit Cap Rates
For experienced investors, the analysis doesn't end on day one. A crucial concept is the relationship between the “going-in” cap rate and the projected “exit” cap rate.
Going-In Cap Rate: Your Day 1 yield, calculated using the first year’s projected NOI and your total purchase price.
Exit Cap Rate: The cap rate you forecast for the day you plan to sell the property, used to determine the projected sale price.
The spread between these two numbers reveals a great deal about the risk assumptions in a deal. A smart, conservative underwriting approach almost always assumes the exit cap rate will be higher than the going-in rate. This builds a margin of safety into the financial model, protecting you if the market softens or interest rates rise.
Investor Take: The spread between your going-in and exit cap rates is a direct window into your risk assumption. If you're buying at a 6% cap and projecting a 5% exit cap, you're betting on market appreciation to generate your return. That's a speculative bet. A flat or slightly higher exit cap (e.g., exiting at 6.25%) is the hallmark of disciplined, conservative underwriting.
Checklist: Questions Every Investor Should Ask a Sponsor
To ensure a sponsor’s assumptions are grounded in reality, you have to ask the right questions. This is essential due diligence for any passive investor.
NOI Verification: How does the trailing 12-month (T12) NOI compare to the pro-forma Year 1 NOI? If there’s a big jump, what specific operational changes justify it?
Rent Growth Reality: What annual rent growth are you assuming? How does that compare to the submarket’s actual 3-year and 5-year historical averages?
Expense Assumptions: Are the property tax projections based on a post-sale reassessment of the property’s new, higher value? (This is a classic "gotcha".)
Exit Cap Logic: What market data justifies your projected exit cap rate? How does it compare to what similar properties have actually sold for recently?
Stress Test: What happens to the deal’s projected returns if the exit cap rate increases by 50 or 100 basis points?
Asking these tough questions helps you pressure-test the deal from every angle and ensures you’re partnering with sponsors who are as disciplined and conservative as you are.
Common Questions About Cap Rate Calculations
Even after you get the formula down, a few practical questions always pop up. Let's tackle some of the most common ones we hear from investors, cutting through the noise to give you clear, direct answers.
How Does a Mortgage Affect the Cap Rate?
It doesn’t—and that’s by design. The cap rate formula is Net Operating Income (NOI) / Property Value. NOI is a pre-debt metric, calculated before factoring in any mortgage payments. This allows you to compare the pure operational performance of different properties on a level playing field, regardless of how an investor decides to finance them.
Can a Cap Rate Be Negative?
Yes, but it’s a massive red flag. A negative cap rate means the property’s Operating Expenses are higher than its Effective Gross Income. In short, the property is losing money just by keeping the lights on, before a single mortgage payment is made. This typically signals a distressed asset requiring a significant turnaround.
Why Is a Cap Rate in New York City So Different From One in Cleveland?
It boils down to perceived risk and expected growth. A prime multifamily building in a "gateway market" like Manhattan is seen as incredibly stable and low-risk, with a high likelihood of long-term appreciation. Investors pay a premium for that safety, which drives property values up and pushes the cap rate down. A similar building in a secondary or tertiary market like Cleveland may face weaker rental demand and slower growth prospects. The market perceives more risk, so investors demand a higher initial return, resulting in a higher cap rate.
Investor Takeaway: Think of the cap rate as a market sentiment indicator. It shows you what investors in a specific area are willing to pay for one dollar of net operating income from a specific type of property.
What's the Difference Between Cap Rate and Cash-on-Cash Return?
This is a crucial distinction. The cap rate shows you a property’s unlevered return—it ignores financing. Cash-on-cash return, however, measures the return on the actual cash you invested, making it a levered, post-financing metric.
Cap Rate: Tells you how the property itself is performing.
Cash-on-Cash Return: Tells you how your equity is performing.
Using a mortgage can significantly increase your cash-on-cash return, even on a property with a modest cap rate. To dig into how these two metrics work together, check out our clear guide on cash-on-cash return for real estate investors.
Take the Next Step in Your Investment Journey
Well-structured real assets can be a prudent, resilient component of a long-term wealth strategy. At Stiltsville Capital, we connect accredited investors with meticulously vetted commercial real estate opportunities designed to preserve and grow capital.
Information presented is for educational purposes only and does not constitute an offer to sell or a solicitation of an offer to buy securities. Any offering is made only through definitive offering documents (e.g., private placement memorandum, subscription agreement) and is available solely to investors who meet applicable suitability standards, including “Accredited Investor” status under Rule 501 of Regulation D. Investments in private real estate involve risk, including loss of capital, illiquidity, and no guarantee of distributions. Past performance is not indicative of future results.
Comments