top of page
Search

Reading Time: 8 min | Good for: Novice Investors (A), Informed Principals (B)


TL;DR: Key Takeaways on IRR


  • What It Is: The Internal Rate of Return (IRR) is the single annualized interest rate an investment is projected to earn over its entire life, accounting for all cash inflows and outflows. Think of it as the project's personal growth rate.

  • Why It Matters: IRR allows you to compare wildly different investment opportunities (e.g., a quick flip vs. a 10-year hold) on a true apples-to-apples basis because it incorporates the crucial element of time.

  • How It's Calculated: While the manual formula is complex, investors use spreadsheet functions like for simple cases and for realistic scenarios with irregular cash flows—the gold standard in real estate.

  • Beyond the Number: A high IRR isn't everything. It must be analyzed alongside the project's risk profile and paired with other key metrics like the Equity Multiple to get a complete picture.


Before we jump into the number-crunching, let’s get a real feel for what the Internal Rate of Return (IRR) actually is.


Think of it as the personal interest rate your investment earns over its entire lifespan. It’s a single number that accounts for every dollar you put in, every dollar you get back, and when it all happens. A higher IRR simply means a more profitable deal, which is why it's such a go-to metric for comparing different opportunities.


What Is the Internal Rate of Return in Real Estate?


The Internal Rate of Return (IRR) is a metric that calculates the annualized, compounded return you can expect from an investment. Technically speaking, it’s the discount rate that makes the Net Present Value (NPV) of all cash flows (both in and out) equal to zero.


But let's put that in simpler terms.


Imagine you put $1,000 into a special bank account. Over five years, you make a few more deposits, take out some cash, and earn interest along the way. When you finally close the account, the IRR would be the one, single, fixed annual interest rate that bank would have needed to pay you to end up with the exact same amount of money.


A mini house, calculator, pen, and documents on a wooden desk with a 'Understand IRR' sign.


This idea is incredibly powerful in real estate because deals are never as simple as "buy low, sell high." There’s always a stream of cash flows spread out over time:


  • Initial Outlay (Negative Cash Flow): Your down payment, closing costs, and any immediate renovation funds.

  • Operating Cash Flows (Positive or Negative): The net income from rent after all expenses are paid.

  • Capital Events (Negative/Positive): A cash call for a major repair, or a cash-out refinance.

  • Terminal Value (Positive Cash Flow): The big one—your net proceeds when you sell the property.


IRR is the magic wand that turns this messy, multi-year financial story into a single, clean, annualized percentage. It lets you compare wildly different projects—say, a quick one-year flip versus a ten-year stabilized apartment building—on a true apples-to-apples basis.


Novice Lens: Why IRR MattersDon't get tripped up by the financial jargon. At its heart, IRR answers one simple question: "What annual rate of return did my money actually earn while it was tied up in this project?" It's a much smarter way to look at performance than a basic profit percentage because it understands that a dollar today is worth more than a dollar tomorrow.

Historically, strong performance has made IRR a cornerstone metric for real estate investments. For instance, data from INREV (as of 2023) shows that certain vintage years of private real estate funds delivered average IRRs around 14%, highlighting the kind of returns this asset class can generate.


Calculating a Simple IRR With Consistent Cash Flows


The best way to really get a handle on a financial concept is to start with a simple, clean example. So for our first run-through, we're going to strip away all the usual complexities and focus on the pure mechanics of the Internal Rate of Return. Let’s walk through a hypothetical deal for a small, single-tenant office building with predictable and steady cash flows.


Imagine you get the chance to buy a small medical office building for $1,000,000. The tenant is a very stable healthcare practice locked into a long-term lease. Your underwriting shows that after covering all the operating expenses and property taxes, the investment will kick off $80,000 in positive cash flow every year for the next five years. At the end of that 5-year hold, you plan to sell the property, walking away with $1,200,000 after all closing costs.


This is the perfect scenario for our first IRR calculation because the cash flows are even and easy to follow.


A model building and laptop displaying an 'IRR Example' spreadsheet, symbolizing real estate investment analysis on a desk.


Setting Up Your Cash Flows


The very first step in any IRR calculation is to map out your cash flows over time. Timing is everything here. In the world of real estate finance, "Year 0" is always the starting point—it represents the moment you write the check and the money leaves your bank account.


Here’s the cash flow stream for our office building deal:


  • Year 0: -$1,000,000 (Your initial purchase is a negative cash flow, or an outflow.)

  • Year 1: +$80,000 (Net operating income)

  • Year 2: +$80,000 (Net operating income)

  • Year 3: +$80,000 (Net operating income)

  • Year 4: +$80,000 (Net operating income)

  • Year 5: +$1,280,000 (This lumps together the final year's $80,000 income plus the $1,200,000 you get from the sale.)


Pay close attention to that final year. We're combining both the property's income and the sale proceeds into one number. That's a critical detail you have to get right for the calculation to be accurate.


Using the IRR Formula in a Spreadsheet


Look, you could solve for IRR with a pen, paper, and a lot of patience, but why would you? In reality, every investor on the planet uses a spreadsheet program like Microsoft Excel or Google Sheets. These tools have a built-in function that does all the heavy lifting instantly.


Finding the IRR is incredibly straightforward:


  1. List out all the cash flows in order, either in a single column or a single row.

  2. Type in the formula and simply select the entire range of your cash flows.

  3. Just make sure your initial investment is entered as a negative number. That's key.


A model building and laptop displaying an 'IRR Example' spreadsheet, symbolizing real estate investment analysis on a desk.


The spreadsheet spits out an IRR of 11.2%. What does that number actually tell you? It means this project is projected to generate an average annualized, compounded return of 11.2% over its five-year life. Just like that, you have a powerful benchmark to compare this deal against any other investment opportunity you might be considering, whether it's another property or something in a completely different asset class.


Modeling a Realistic IRR With Irregular Cash Flows


The simple office building example was a great warm-up, but let's be honest—real estate is rarely that neat. Value-add and opportunistic projects, the very strategies that can generate exceptional returns, are almost defined by their uneven, unpredictable cash flows.


This is where the standard formula in Excel hits a wall, and where a more powerful tool becomes absolutely essential for any serious investor.


Deal Lens: The Value-Add Multifamily Scenario


Let's model a more realistic internal rate of return example using a value-add multifamily property. Here, the cash flows aren't a tidy, repeating annuity. They fluctuate based on the business plan, creating a lumpy financial timeline that is far more typical of a sophisticated real estate investment.


Imagine Stiltsville Capital is acquiring a 50-unit apartment building for $5,000,000. The property is tired and rents are way below market. The game plan? Inject another $500,000 into renovations to modernize units, upgrade amenities, and push rents to their full potential.


This business plan creates a much more complex cash flow stream:


  • Initial Purchase: A $5,000,000 outflow right at the start.

  • Capital Call: A $500,000 outflow six months later to fund the renovations.

  • Fluctuating Income: Cash flow dips in the first year due to renovation disruption, then ramps up as upgraded units are leased at higher rates.

  • The Exit: The stabilized, high-performing asset is sold at the end of Year 4.


This is a classic value-add play, and its financial signature is irregularity.


Meet Your New Best Friend: The XIRR Formula


Because cash flows don't fall on perfect annual intervals (like that renovation capital call at month six), the standard function is the wrong tool for the job. It’s built on the assumption of equal time periods between each cash flow, an assumption that would completely distort our final number.


The solution is the XIRR function in Excel or Google Sheets. The 'X' handles irregular, specifically dated cash flows, making it the undisputed gold standard for real estate and private equity analysis.


Investor Takeaway: When you get a financial model from a sponsor, check if they are using XIRR. If the deal involves capital calls, refinances, or any cash flow event that doesn't happen neatly on January 1st each year, is the only function that gives you an accurate annualized return.

How to Structure the XIRR Calculation


Using is surprisingly simple. You just need two columns: one for the specific dates of each cash flow and one for the corresponding dollar amount. It’s a precise log of every dollar in and out, and exactly when it happened.


Here's how the cash flow for our value-add project would look in a spreadsheet:


Date

Cash Flow

Description

1/1/2024

-$5,000,000

Initial Property Purchase

7/1/2024

-$500,000

Capital Call for Renovations

12/31/2024

+$150,000

Net Income - Year 1 (Lower due to vacancy)

12/31/2025

+$350,000

Net Income - Year 2 (Stabilizing)

12/31/2026

+$450,000

Net Income - Year 3 (Fully Stabilized)

12/31/2027

+$7,450,000

Year 4 Income ($450k) + Sale Proceeds ($7M)


The formula you'd pop into your spreadsheet is .


Using the values from our table, the function calculates an IRR of 18.7%.


This 18.7% figure gives us a true, time-weighted annualized return that accurately reflects every twist and turn in the investment's lifecycle. It correctly penalizes the project for requiring more capital mid-stream and rewards it for the large payout at the end. Mastering the calculation isn't just a good idea—it's a non-negotiable skill for accurately vetting any private real estate deal that comes across your desk.


How Leverage Amplifies Your Real Estate IRR


So far, the examples we’ve walked through have been on an “unlevered” basis. In simple terms, that means we analyzed them as if they were all-cash purchases.


But in the world of institutional real estate, that’s just not how major deals get done. The strategic use of debt, or leverage, is one of the most powerful tools for amplifying returns—and this is where IRR analysis really gets interesting.


Leverage lets you control a large, valuable asset with only a fraction of its total cost coming out of your own pocket. Think of it as using the bank's money to boost your own potential profits. When the return your property generates is higher than the interest rate on your loan, you create what's called positive leverage. The impact on your IRR can be dramatic.


A Side-by-Side Example: Unlevered vs. Levered


To make this concept crystal clear, let's run a side-by-side internal rate of return example for the same exact asset—once with no debt (unlevered) and once with financing (levered).


Let's imagine we're acquiring a $10,000,000 multifamily property.


  • The Hold Period: 5 years.

  • The Exit: We plan to sell at the end of Year 5 for $12,500,000.


Now, let’s see how the numbers change when we introduce a loan. For a deeper dive into financing strategies, our guide to commercial real estate financing options for investors covers this in much more detail.


Scenario 1: The Unlevered (All-Cash) Purchase


In this scenario, you and your fellow investors pool together the full $10 million in cash. It's straightforward—all the net operating income from the property flows directly to you. The cash flow is simple and clean.


Scenario 2: The Levered (Financed) Purchase


Here, we'll take a more typical institutional approach. We secure a loan for 70% of the purchase price, or $7,000,000. This means the total equity required from investors is only $3,000,000. The catch? Each year, we must make debt service payments (principal and interest) before we can distribute any cash flow.


The difference this makes is huge.


Bar chart comparing unlevered internal rate of return (around 720) with levered (around 1580).


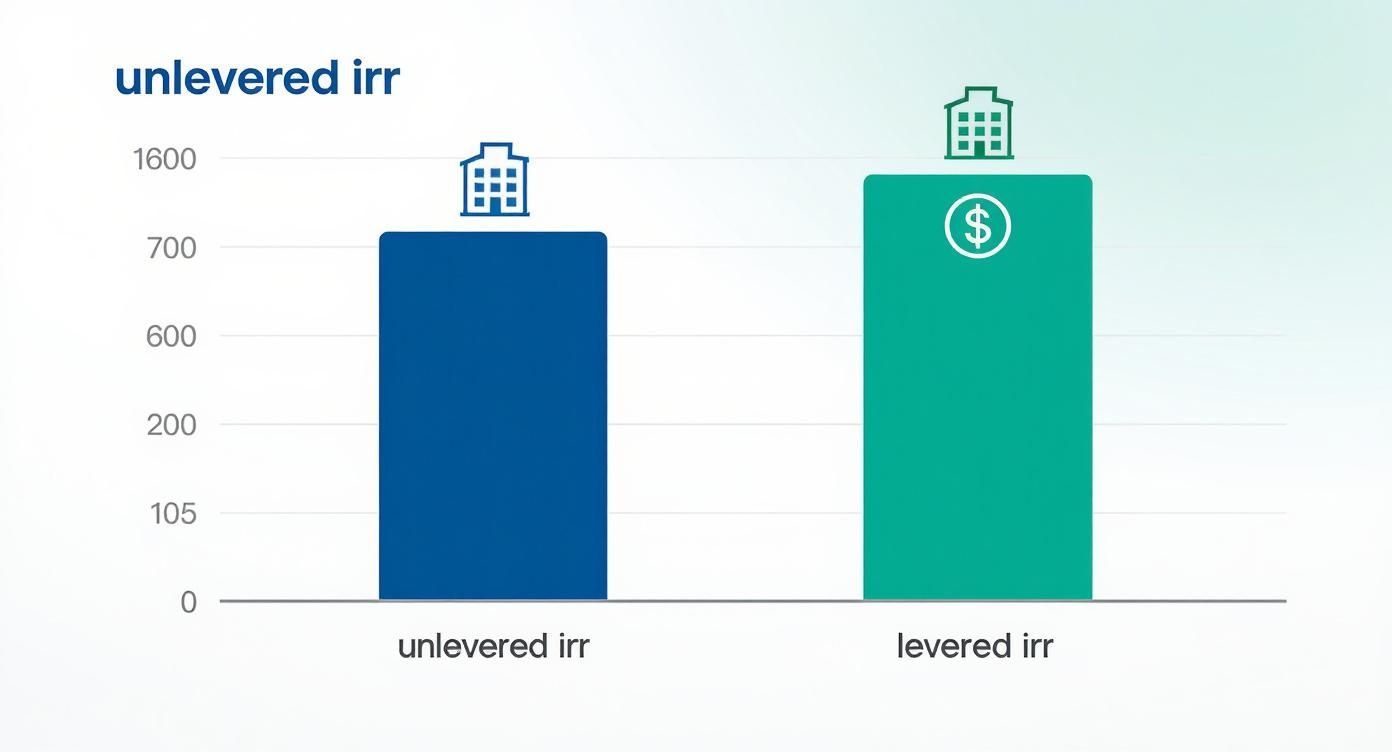
As you can see, the levered IRR is significantly higher. Why? Because those returns are being generated from a much smaller initial investment of your own money.


Breaking Down the Cash Flows


Let’s get into the nitty-gritty of the numbers to see how this amplification really works. The table below gives you an illustrative breakdown of the annual cash flows for both scenarios. Pay close attention to how the initial investment in Year 0 is dramatically different, and how the annual cash flows in the levered case are reduced by the debt service payments.


Illustrative Levered vs. Unlevered IRR Comparison


Year

Unlevered Cash Flow

Levered Cash Flow (Post-Debt Service)

Notes

0

-$10,000,000

-$3,000,000

Initial Investment (Equity)

1

+$600,000

+$180,000

NOI minus Debt Service

2

+$620,000

+$200,000

NOI minus Debt Service

3

+$640,000

+$220,000

NOI minus Debt Service

4

+$660,000

+$240,000

NOI minus Debt Service

5

+$13,180,000

+$6,360,000

Sale Proceeds + Final NOI, Less Loan Payoff

IRR

9.9%

23.1%


The results are stark. The all-cash deal generates a respectable 9.9% IRR. That's not bad.


But by using sensible leverage, the IRR on the equity we invested skyrockets to 23.1%. We’ve more than doubled our annualized return simply by financing the acquisition strategically.


Advanced Lens: For Sophisticated InvestorsThis relationship between property-level returns and equity-level returns is the engine of private equity real estate. A sponsor's ability to secure favorable financing and manage the capital stack is just as critical as their ability to operate the property itself.

This powerful amplification is exactly why understanding the difference between levered and unlevered returns is non-negotiable for any serious real estate investor.


Looking Beyond IRR: An Investor's Checklist


A high Internal Rate of Return is undeniably attractive. It’s the headline number that grabs your attention in any pitch deck. But experienced investors know that while IRR is a powerful metric, it isn't the whole story—it has some critical blind spots. Relying solely on IRR is like judging a luxury car by its top speed. Sure, it’s an impressive number, but it tells you nothing about fuel efficiency, safety, or the total cost of ownership.


Questions to Ask Before Investing Based on IRR


Here are five diligence questions you should ask to look beyond the headline IRR and understand the true risk-return profile of a deal:


  • 1. What are the key assumptions driving this IRR? (e.g., rent growth, exit cap rate). Are they conservative or aggressive compared to the market?

  • 2. How does the IRR change in a downside scenario? Ask the sponsor to show you a sensitivity analysis. What happens if rent growth is slower or the exit cap rate is higher than projected?

  • 3. What is the Equity Multiple? This metric shows total profit. A high-IRR deal over a short hold period might produce less total cash than a lower-IRR deal held for longer.

  • 4. What is the deal's risk profile? A 20% IRR on a high-risk development project is not the same as a 15% IRR on a light value-add multifamily deal. Does the return justify the risk?

  • 5. What is the assumed reinvestment rate? IRR's biggest flaw is that it assumes all cash distributions can be reinvested at the same high rate. This is rarely true and can overstate returns.


The Reinvestment Rate Assumption


The single biggest technical flaw in the IRR calculation is its built-in reinvestment assumption. The formula inherently assumes that all positive cash flows you receive during the hold period (like annual rental income) can be reinvested at the exact same rate as the project's final IRR.


This is almost never realistic. If a project has a stellar 22% IRR, the math assumes you can take every single distribution and immediately find another investment that also pays out exactly 22%. In the real world, consistently finding those kinds of opportunities is nearly impossible.


Pair IRR with Other Metrics


To get a complete, 360-degree view of an investment's potential, you should always analyze IRR alongside other key performance indicators. The two most important partners for IRR are the Equity Multiple and Net Present Value (NPV).


  • Equity Multiple (MOIC): This metric is beautifully simple: it tells you how many times over you get your money back. An equity multiple of 2.5x means for every $1 you put in, you got $2.50 back. It completely ignores the time value of money but gives you a crystal-clear measure of total profit.

  • Net Present Value (NPV): NPV tells you what all the future cash flows are worth in today's dollars, using a specific discount rate (your personal required rate of return). A positive NPV means the project is expected to beat your minimum return threshold.


Beyond doing the math by hand, sophisticated investors can use an AI Finance Investment Analyst agent to automate these complex analyses, helping to look beyond just the IRR. This holistic approach ensures you understand not just the speed of your returns (IRR), but also the total amount of profit you’ll make (Equity Multiple) and the true value it creates (NPV).


Common Questions about IRR in Real Estate


Let's wrap up with some of the most common questions that come up when investors start using IRR. Think of this as the practical Q&A session to clear up any lingering confusion and make sure you can apply these concepts with confidence.


What's the Real Difference Between IRR and ROI?


Return on Investment (ROI) is a blunt instrument—it tells you how much money you made relative to what you put in, but it completely ignores when you made it. A 50% return that took one year looks identical to a 50% return that took five years, and that's a huge blind spot.


Internal Rate of Return (IRR), on the other hand, is much sharper. It’s an annualized metric that has the time value of money baked right in. It gives you the compound annual growth rate, which is the only way to truly compare deals with different hold periods and cash flow schedules.


Can You Actually Get a Negative IRR?


You bet. A negative IRR simply means the investment lost money on a year-over-year basis. It’s a clear signal that the cash you got back was less than the cash you put in.


Essentially, the deal didn't just fail to produce a profit; it actually eroded your original capital at a compounded rate. It's not a result anyone wants, but it’s a brutally honest measure of an underperforming asset.


Why Is IRR the Go-To Metric in Private Equity Real Estate?


Private equity real estate deals are almost never straightforward. You have a big cash outlay at the start, maybe more cash calls for renovations down the line, followed by irregular rental income, and then a big payday when the property sells. It's a messy financial timeline.


IRR is the industry standard because it’s one of the few tools that can take that entire complicated journey and boil it down to a single, annualized number. It lets investors and sponsors compare wildly different projects—like a two-year value-add flip versus a ten-year ground-up development—on a true apples-to-apples basis.


What's Considered a "Good" IRR for a Real Estate Deal?


There's no magic number here. A "good" IRR is all about the risk you're taking to achieve it. The higher the risk, the higher the IRR needs to be to make the deal worthwhile. As a general rule, here’s what institutional investors often target:


  • Core Strategy (Low Risk): For stable, fully-leased properties, target IRRs are often in the high single digits to low double-digits (8-12%).

  • Value-Add Strategy (Medium Risk): For projects involving renovation or re-leasing, targets typically move into the mid-to-high teens (14-18%).

  • Opportunistic Strategy (High Risk): For ground-up development or major repositioning, investors expect IRRs of 20% or higher to justify the significant risk.


Take the Next Step


At Stiltsville Capital, IRR isn't just a number—it's a core part of the disciplined underwriting we perform on every deal. It helps us ensure that every opportunity is stress-tested to meet the risk-adjusted return targets our investors count on. Well-structured real assets can be a prudent, resilient component of a long-term wealth strategy.


If you’re an accredited investor curious to see how we apply these metrics to live, institutional-grade real estate opportunities, we invite you to schedule a confidential call with our team.


Information presented is for educational purposes only and does not constitute an offer to sell or a solicitation of an offer to buy securities. Any offering is made only through definitive offering documents (e.g., private placement memorandum, subscription agreement) and is available solely to investors who meet applicable suitability standards, including “Accredited Investor” status under Rule 501 of Regulation D. Investments in private real estate involve risk, including loss of capital, illiquidity, and no guarantee of distributions. Past performance is not indicative of future results. Verification of accredited status is required for participation in Rule 506(c) offerings.


Reading Time: 8 min | Good for: Novice Investors (A), Informed Principals (B)


TL;DR: What You Need to Know


  • What it is: The capitalization rate (cap rate) is a fundamental metric in real estate, measuring a property's potential annual return on an all-cash purchase. Think of it as the dividend yield for a building.

  • How it works: Calculated as Net Operating Income (NOI) / Property Value, the cap rate shows the raw, unleveraged relationship between the income a property produces and its market price.

  • Why it matters: It provides a common yardstick to quickly compare different investment opportunities and gauge relative risk. A lower cap rate typically signals lower risk and higher value, while a higher cap rate suggests higher potential returns but often with greater risk.

  • The Investor Angle: Sophisticated investors don't just analyze cap rates; they actively work to compress them. The core of a value-add strategy is buying at a higher cap rate (lower value) and selling at a lower cap rate (higher value) after increasing the property's income.


The Market Why-Now: A Shifting Landscape


For investors allocating capital, understanding cap rate dynamics is more critical than ever. After a prolonged period of historically low interest rates that compressed cap rates to record lows, the market has entered a new phase. According to recent data from CBRE (as of Q1 2024), cap rates have expanded across most major asset classes over the past 18 months in response to tighter monetary policy. This shift creates both challenges and distinct opportunities for discerning investors who can identify mispriced assets and execute on value-add business plans.


Understanding The Cap Rate: A Simple Analogy


For investors new to commercial real estate, "cap rate" can sound like insider jargon. But it's one of the most fundamental tools for comparing investment opportunities, allowing a quick assessment of a property’s performance without getting bogged down by financing details.


The easiest way to think about it is to draw a parallel to the stock market. The cap rate is to real estate what the dividend yield is to a stock. A dividend yield tells you the annual cash payout as a percentage of the stock’s price. A cap rate does the exact same thing for a property—it shows the building's annual net income as a percentage of its current value.


Why It Matters for Novice Investors: The cap rate gives you a simple, standardized way to compare the raw profitability of a Miami high-rise versus a Tampa warehouse, regardless of how they are financed. It levels the playing field for an initial comparison.

The Core Formula


The math behind it is refreshingly straightforward:


Cap Rate = Net Operating Income (NOI) / Property Value

Let’s quickly unpack those two pieces:


  • Net Operating Income (NOI): This is the total income a property generates (from rent and other sources) after you’ve paid all necessary operating expenses. This includes property taxes, insurance, maintenance, and management fees. Critically, NOI excludes mortgage payments, major capital repairs, and income taxes. It’s the pure, unlevered income from the asset itself.

  • Property Value: This is simply what the property is worth on the market today—or the price you’d pay to buy it.


When you divide the annual income by the price, you get a percentage representing the raw, unlevered return.


Typically, you'll see cap rates for commercial properties fall somewhere between 4% to 10%. As a rule of thumb, higher cap rates can signal bigger potential returns, but they often come with more risk. You can get a deeper look into commercial real estate cap rates to build on this concept.


What the Number Tells You


That final percentage is a powerful signal of risk and reward. A higher cap rate often points to a higher potential first-year return, but it might also be a red flag about perceived risk. On the flip side, a lower cap rate usually indicates a more stable, lower-risk asset—think a building with a long-term lease to a Fortune 500 company—which commands a higher price and therefore a lower initial yield.


How To Calculate The Cap Rate: A Practical Example


Knowing the formula is one thing; applying it to a live deal is where smart investing begins. It’s how we cut through the noise to see a property's true earning power.


Let's walk through an illustrative example using a 100-unit multifamily property, a core focus for Stiltsville Capital. Our first goal is to determine the Net Operating Income (NOI).


Step 1: Start With Gross Potential Rent


First, we calculate the maximum possible income if every unit were rented at market rate for the entire year.


  • 100 units x $1,500/month average rent = $150,000 per month

  • $150,000/month x 12 months = $1,800,000 (Gross Potential Rent)


Step 2: Find The Effective Gross Income


Now, we adjust for reality. We must account for vacancy (empty units) and credit loss (tenants who don't pay). Assuming a 5% loss rate, which is standard for a stabilized property:


  • $1,800,000 (Gross Potential Rent) x 5% = $90,000 (Vacancy & Credit Loss)

  • $1,800,000 - $90,000 = $1,710,000 (Effective Gross Income)


This is a much more realistic picture of the cash collected.


Step 3: Calculate Net Operating Income


Next, we subtract all the operating expenses required to run the property. To get an accurate cap rate, you must first master the property's Net Operating Income, a figure closely tied to its operating cash flow.


Common operating expenses include:


  • Property Taxes: $200,000

  • Insurance: $100,000

  • Property Management (4% of EGI): $68,400

  • Repairs & Maintenance: $75,000

  • Utilities (common areas): $40,000

  • General & Administrative: $25,000

  • Total Operating Expenses: $508,400


For a deeper dive, our guide on how to find Net Operating Income breaks this down even further.


$1,710,000 (EGI) - $508,400 (Operating Expenses) = $1,201,600 (Net Operating Income)

This is the golden number. The NOI represents the property's annual profit before factoring in any loan payments or income taxes.


Illustrative NOI and Cap Rate Calculation for a 100-Unit Multifamily Property


Metric

Calculation/Notes

Amount

Gross Potential Rent (GPR)

100 units x $1,500/mo x 12 months

$1,800,000

Vacancy & Credit Loss

5% of GPR

($90,000)

Effective Gross Income (EGI)

GPR - Vacancy & Credit Loss

$1,710,000

Total Operating Expenses

Sum of all property-level costs

($508,400)

Net Operating Income (NOI)

EGI - Total Operating Expenses

$1,201,600

Property Value (Purchase Price)

Assumed market price

$20,000,000

Cap Rate

NOI / Property Value

6.01%


This step-by-step flow shows exactly how we arrive at the final cap rate.


Diagram illustrating the Cap Rate Formula: Net Operating Income (NOI) divided by Value.


Step 4: Apply The Cap Rate Formula


With our NOI and an assumed purchase price of $20,000,000, the final step is simple.


  • Cap Rate = $1,201,600 (NOI) / $20,000,000 (Value)

  • Cap Rate = 6.01%


This means an all-cash purchase of this property would yield a 6.01% return in the first year before considering debt.


Trailing vs. Pro-Forma Cap Rates


One final, critical distinction: you must always ask which numbers are being used.


  • Trailing Cap Rate: Calculated using historical data, usually the last 12 months of performance (the "T12"). It tells you what the property has done. It's fact-based.

  • Pro-Forma Cap Rate: Uses projected future income and expenses. This is what you'll see in a value-add business plan, showing what the property could do after renovations and rent increases.


As an investor, you must scrutinize the assumptions behind any pro-forma cap rate. At Stiltsville Capital, we anchor our analysis in trailing numbers to establish a baseline of proven performance before modeling future potential.


What A Good Cap Rate Really Looks Like


So, what’s the magic number? The honest answer is… there isn’t one. A great cap rate for one investor might be an easy pass for another. It all comes down to context, risk appetite, and investment strategy.


A common mistake is chasing the highest cap rate. While a high cap rate signals stronger initial cash flow relative to the price, it almost always comes with a story—perhaps a challenged location, a building needing significant work, or unstable tenancy.


Conversely, a low cap rate isn't automatically "bad." It usually signals quality, stability, and high demand. A brand-new apartment building in a prime downtown location will have investors lining up, pushing the price up and, consequently, the cap rate down.


Two tall apartment buildings and a shorter brick building under a clear blue sky, with 'Cap Rate Signals' text.


The See-Saw Relationship Between Cap Rates and Value


If there’s one thing to remember, it’s the inverse relationship between cap rates and property values. They move in opposite directions.


  • When cap rates go down (compress): Property values go up. This happens when a market gets hotter, interest rates fall, or an asset becomes more desirable.

  • When cap rates go up (expand): Property values go down. This can be triggered by rising interest rates, economic uncertainty, or property-specific issues.


This push and pull is a fundamental pattern in real estate cycles.


Market Signal Box: A Snapshot of Today's Cap Rate Ranges


To give you a real-world baseline, here’s a look at typical cap rate ranges for different commercial property types in major U.S. markets.


Investor Take: As of late 2024, the market continues to adjust to a higher interest rate environment. This has caused cap rates to expand across the board from the historic lows of 2021. According to JLL's Q2 2024 outlook, we see the following approximate ranges:* Multifamily: 5.0% - 6.0%. Sunbelt markets continue to show strength from job growth, though a wave of new supply has tempered rent growth in some submarkets.* Industrial / Logistics: 4.5% - 5.5%. This sector remains a favorite, fueled by e-commerce and supply chain onshoring, keeping cap rates relatively tight.* Neighborhood Retail: 6.0% - 7.5%. Centers anchored by grocery stores or other essential services demonstrate resilience, but rates reflect a higher perceived risk compared to industrial or multifamily.

Knowing these benchmarks is a start, but the real diligence begins when you ask "why" a specific property's cap rate deviates from the market average. For more detail, check our guide on what constitutes a good cap rate for real estate investors.


Key Factors That Drive Cap Rates Up Or Down


Cap rates are living metrics that shift with a mix of macroeconomic forces and property-specific details. Understanding these drivers is crucial for anticipating market shifts and spotting true value. These forces cause cap rates to either compress (go down, pushing values up) or expand (go up, pushing values down).


A city skyline and water at dusk with 'RATE DRIVERS' text and magnifying glass icons.


Macroeconomic Drivers The Big Picture


These are broad market currents that affect all investments.


  • Interest Rates: This is the big one. When the cost of borrowing rises, investors demand higher returns to compensate, causing cap rates to expand. Conversely, lower interest rates make financing cheaper, boosting demand and compressing cap rates.

  • Capital Flows: When a flood of capital chases real estate deals, the competition drives prices higher and cap rates lower. When that capital retreats, the opposite occurs.

  • Economic Growth & Employment: A strong economy with robust job growth fuels demand for all types of real estate. This positive momentum and potential for rent growth lead to lower, more compressed cap rates.


Property-Level Drivers What Makes An Asset Unique


These factors are specific to the property and its immediate submarket. This is where a sponsor’s deep expertise becomes a critical advantage.


  • Asset Type & Class: A new industrial facility leased to a major e-commerce company will trade at a much lower cap rate than an aging suburban office building with high vacancy. The perceived stability of the sector is a massive driver.

  • Location: The old mantra holds true. A multifamily property in a booming Sunbelt city will command a premium price and a lower cap rate than a similar building in a market with a declining population.

  • Tenant Quality & Lease Term: A property with a 15-year lease to a credit-grade national tenant is seen as nearly as safe as a corporate bond, warranting a very low cap rate. A building with many small tenants on short-term leases carries more risk and will trade at a higher cap rate.


Factors Driving Cap Rate Movement


Factor

Impact on Cap Rate Compression (Lower Rates)

Impact on Cap Rate Expansion (Higher Rates)

Interest Rates

Federal Reserve lowers rates, making debt cheaper.

Federal Reserve raises rates, making debt expensive.

Economic Outlook

Strong GDP growth, low unemployment, high consumer confidence.

Recession fears, rising unemployment, low consumer confidence.

Capital Flows

High investor demand, lots of available capital chasing deals.

Capital flight, tighter lending standards from banks.

Asset Location

Prime urban core or a high-growth Sunbelt market.

Secondary or tertiary market with a declining population.

Tenant Profile

Long-term leases with high-credit, investment-grade tenants.

Short-term leases with small, unrated, or local tenants.

Asset Quality

New construction, Class A, with modern, in-demand amenities.

Older building, Class C, needs significant capital improvements.


At Stiltsville Capital, we constantly analyze these trends—not just to value properties today, but to forecast how those values might change over the life of an investment.


Why Cap Rate Is Only Part of The Story


Relying on cap rate alone is like driving a car by only looking at the speedometer. It’s vital, but it tells you nothing about the road ahead. The cap rate is a snapshot in time that can be misleading in isolation.


Its biggest weakness is what it ignores: the impact of financing, the time value of money, future rent growth, and the profit from an eventual sale. A 6% cap rate might seem less attractive than an 8% cap rate, but if the 6% deal has a clear path to major NOI growth, it could easily be the superior long-term investment.


To build a complete view, sophisticated investors layer in complementary metrics.


Beyond the Snapshot: Complementary Metrics


  • Internal Rate of Return (IRR): If cap rate is a snapshot, IRR is the full-length movie. It calculates the total annualized return over the entire holding period, factoring in the initial investment, all income generated, and the final profit from the sale.

  • Cash-on-Cash Return: This metric brings leverage into the equation. It answers the question: "For every dollar I invest, how much cash do I get back each year?" It’s calculated as the annual pre-tax cash flow divided by the total cash invested.

  • Equity Multiple: This shows the total cash returned as a multiple of the original investment. A 2.0x equity multiple simply means you doubled your money. It’s a straightforward measure of total profit.


While cap rates offer a valuable snapshot, they are just one piece of the puzzle. To understand the full financial picture, you must delve deeper into how to calculate Return on Investment (ROI) for real estate.


Advanced Lens: Building the Financial ModelFor institutional investors and family offices, these metrics are interconnected components of a comprehensive financial model. We start with the going-in cap rate to establish a baseline. Then, we project future cash flows by modeling rent growth and operational improvements to forecast the IRR. By layering on specific debt assumptions, we can calculate the cash-on-cash return. Finally, we underwrite a conservative exit cap rate to determine the final sale price and the resulting equity multiple. This integrated approach is the only way to make a truly informed, risk-adjusted investment decision.

How We Use Cap Rates To Create Investor Value


At Stiltsville Capital, we don’t just analyze cap rates—we actively engineer them. Our value-add strategy boils down to a simple but powerful concept: buy at a high cap rate, sell at a low one.


This means we acquire properties that are underperforming—often with dated units, below-market rents, or inefficient management—at a relatively high cap rate. This higher initial yield reflects the property's current issues and perceived risk.


Engineering Cap Rate Compression


Once we acquire a property, our work begins. We execute a targeted business plan to systematically increase the Net Operating Income (NOI). This might involve modernizing apartments, adding in-demand amenities, or implementing better expense controls.


By forcing the NOI higher, we fundamentally change the property's financial profile. A higher NOI makes the property more valuable to the next buyer, which naturally leads to a lower, or "compressed," cap rate at the time of sale. The profit for our investors is driven by the spread we create between the high “going-in cap rate” we bought at and the lower "exit cap rate" we sell at. For a deeper dive, check out our guide on proven strategies to add value to real estate investments.


Investor Checklist: Questions to Ask a Sponsor About Cap Rate Assumptions


A sponsor’s cap rate assumptions are one of the most critical parts of any investment memorandum. Overly optimistic projections can make a mediocre deal look like a home run. As an investor, it is your job to pressure-test these numbers.


  • What is the going-in cap rate, and how does it compare to recent, comparable sales in the submarket?

  • What is your projected exit cap rate, and what market data supports that assumption?

  • How does your exit cap rate compare to the going-in cap rate? (A conservative model often assumes an exit cap rate slightly higher than the entry cap rate to build in a margin of safety.)

  • What are the specific, actionable steps you will take to grow the NOI?

  • What happens to my returns if the exit cap rate is 50 or 100 basis points higher than you've projected? (Stress-testing the model is non-negotiable.)


Take the Next Step


Understanding the cap rate is the first step toward building a resilient portfolio of real assets. As markets evolve, partnering with a sponsor who brings disciplined underwriting and a hands-on approach to value creation can be a significant advantage.


If you are an accredited investor interested in exploring passive institutional-quality real estate opportunities, we invite you to schedule a confidential call with our team.


Disclaimer: Information presented is for educational purposes only and does not constitute an offer to sell or a solicitation of an offer to buy securities. Any offering is made only through definitive offering documents (e.g., private placement memorandum, subscription agreement) and is available solely to investors who meet applicable suitability standards, including “Accredited Investor” status under Rule 501 of Regulation D. Investments in private real estate involve risk, including loss of capital, illiquidity, and no guarantee of distributions. Past performance is not indicative of future results.


  • TL;DR: This guide details 10 primary types of real estate investment, from direct ownership of residential and commercial properties to passive vehicles like REITs and private syndications. It’s designed for accredited investors and family offices to compare strategies based on risk, return, and operational demands.

  • Key Insight: The optimal strategy depends on your capital, risk tolerance, and desired level of involvement. Passive vehicles like syndications, managed by a sponsor like Stiltsville Capital, offer access to institutional-grade deals without the hands-on burden.

  • Next Step: Identify the investment profiles that align with your portfolio goals and learn the key diligence questions for each.


Reading Time: 12 min | Good for Audiences: Novice (A), Informed (B), Sophisticated (C)


Real estate investing is not a monolithic discipline. It's a vast landscape of distinct strategies, asset classes, and vehicles, each with its own risk profile, return potential, and operational demands. For high-net-worth individuals, family offices, and institutional allocators, navigating these options is the critical first step toward building a resilient and profitable real asset portfolio. As global family offices continue to increase allocations to private markets for diversification and inflation hedging (per a recent UBS Global Family Office Report), understanding this landscape is more crucial than ever.


This guide is designed to provide that clarity. We will dissect the primary types of real estate investment, moving beyond simple definitions to explore the practical nuances that matter to sophisticated investors. We will analyze everything from direct property ownership in sectors like multifamily and industrial, to more passive vehicles such as private placements, syndications, and Real Estate Investment Trusts (REITs). For each type, we will detail its core mechanics, typical risk/return spectrum, and investor suitability. You'll gain a clear understanding of the strategic levers at play and learn how a firm like Stiltsville Capital LLC structures opportunities across this diverse ecosystem. While this article provides a global overview, investors seeking a more localized breakdown can explore resources detailing the 10 types of real estate investment relevant to specific regional markets.


1. Residential Rental Properties: The Foundation of Direct Ownership


Among the many types of real estate investment, direct ownership of residential rental properties is perhaps the most traditional and widely understood. This strategy involves purchasing single-family homes, duplexes, or small multi-family buildings with the express purpose of leasing them to tenants.


How It Generates Returns


  • Current Income: Monthly rental payments from tenants form the primary revenue stream. After subtracting operating expenses (mortgage, taxes, insurance, maintenance), the remaining cash flow provides a steady income.

  • Capital Appreciation: Over the long term, the property's market value is expected to increase. This growth, combined with the gradual paydown of the mortgage, builds the owner's equity.


Investor Profile & Suitability


This hands-on approach is best suited for investors who desire a high degree of control and are prepared for active management, from tenant screening to coordinating repairs.


Novice Lens: This is "hands-on" investing. You get tangible assets and tax benefits like mortgage interest deductions. However, a broken water heater at 2 a.m. is your problem to solve. This direct responsibility is a key difference from passive investing in a fund, where a professional sponsor handles all operations.

2. Commercial Real Estate: Investing in the Engine of Commerce


Shifting from individual homes to the places where business happens, commercial real estate (CRE) represents another major category among the types of real estate investment. This broad sector encompasses income-producing properties leased to businesses, including office buildings, retail centers, industrial warehouses, and medical facilities.


Modern commercial office buildings with reflective glass facades on a sunny day, representing commercial income.


How It Generates Returns


  • Current Income: Long-term leases with corporate tenants provide the core revenue. Many are triple-net (NNN) leases, where the tenant pays for taxes, insurance, and maintenance, creating a predictable cash flow.

  • Capital Appreciation: Value is driven by increasing market rental rates, lease renewals, and property upgrades.


Investor Profile & Suitability


Direct investment in CRE typically requires significant capital and market expertise. It is best suited for accredited investors and institutions capable of conducting complex due diligence. For others, passive investment through syndications provides access to institutional-quality assets.


Investor Take: Commercial real estate offers the potential for higher and more stable cash flow compared to residential, thanks to longer lease terms. However, the asset class is more sensitive to economic cycles and requires a deeper understanding of market fundamentals. A firm like Stiltsville Capital specializes in sourcing and managing these complex assets, allowing passive investors to benefit from expert underwriting without the hands-on burden.

3. Real Estate Investment Trusts (REITs): Liquid Access to Diversified Portfolios


For investors seeking portfolio diversification without the burdens of direct property ownership, Real Estate Investment Trusts (REITs) offer a compelling solution. A REIT is a company that owns, operates, or finances income-producing real estate. By investing in a REIT, you are buying shares in a professionally managed portfolio.


How It Generates Returns


  • Dividend Income: By law, REITs must distribute at least 90% of their taxable income to shareholders annually as dividends, creating a consistent income stream.

  • Share Price Appreciation: Similar to a stock, the value of a REIT share can increase over time, driven by the performance of its underlying real estate portfolio.


Investor Profile & Suitability


REITs are exceptionally well-suited for investors who prioritize liquidity and diversification. Because most are publicly traded, they can be bought and sold as easily as any other stock.


Advanced Lens: While REITs offer liquidity, their share prices are correlated with broader equity market sentiment, which can disconnect from the net asset value (NAV) of the underlying properties. This market volatility is a key trade-off versus private real estate, where valuations are tied directly to asset performance. For investors holding appreciated property, a 721 Exchange can provide tax-deferred benefits when contributing assets into certain UPREIT structures.

4. Fix-and-Flip Properties: The Active Pursuit of Appreciation


Popularized by television shows, the fix-and-flip strategy is one of the more active and short-term types of real estate investment. It involves purchasing a distressed property, executing renovations to increase its market value ("forced appreciation"), and selling it for a profit, typically within 6-to-24 months.


How It Generates Returns


  • Forced Appreciation: The primary return is the profit margin between the total project cost (purchase, renovation, holding costs) and the final sale price. Success depends on accurately estimating the after-repair value (ARV) and controlling the renovation budget and timeline.


Investor Profile & Suitability


This strategy is for hands-on investors with a strong understanding of local markets, construction management, and project budgeting. It requires significant upfront capital and a high tolerance for risk.


Investor Take: Fix-and-flip offers the potential for high returns in a short period but is a high-risk, high-effort endeavor that functions more like a business than a passive investment. This contrasts sharply with the role of a Limited Partner in a sponsored real estate deal, where a firm like Stiltsville Capital manages the complexities of a large-scale value-add project.


5. Syndications and Private Placements: Access Through Collective Capital


For investors seeking access to larger, institutional-quality assets, real estate syndications (or private placements) are a powerful vehicle. This structure pools capital from multiple passive investors (Limited Partners or LPs) alongside an active sponsor (General Partner or GP) to acquire and operate assets like large multifamily communities or commercial buildings.


How It Generates Returns


  • Preferred Returns & Distributions: Investors typically receive a "preferred return," a prespecified annual percentage paid from the property's cash flow before the sponsor shares in profits. This provides a consistent income target.

  • Profit Sharing on Exit: Upon sale, remaining profits are distributed according to a predetermined "waterfall" structure. After LPs receive their capital back, profits are split between the investors and the sponsor, creating potential for significant capital gains.


Investor Profile & Suitability


This model is ideal for accredited investors wanting passive exposure to real estate with professional management. Due diligence shifts from analyzing a property to thoroughly vetting the sponsor's track record, business plan, and deal structure.


Investor Take: Syndications offer access to professional-grade management and specific assets with a clear business plan. However, this comes with illiquidity (typically 5-10 year hold periods) and less control compared to public REITs. A firm like Stiltsville Capital acts as the sponsor in such arrangements, leveraging its expertise to execute complex value-add strategies on behalf of its investment partners.

6. Real Estate Wholesaling: The Art of the Deal Pipeline


Distinct from ownership, real estate wholesaling is a transactional strategy focused on identifying and controlling undervalued properties, then assigning the purchase contract to another buyer for a fee. It emphasizes deal-sourcing and negotiation skills over capital deployment.


How It Generates Returns


  • Assignment Fee: A wholesaler secures a property under contract at a low price, finds an end-buyer willing to pay more, and assigns the contract to them. The difference is the wholesaler's fee.


Investor Profile & Suitability


This strategy suits highly proactive individuals with strong networking and sales abilities. It requires minimal capital but demands significant time and effort. It is an active business, not a passive investment.


Investor Take: Wholesaling offers a rapid way to generate income from real estate without the long-term commitments of ownership. However, it provides no passive income, tax benefits like depreciation, or capital appreciation. This high-velocity strategy is the operational opposite of a passive investment in a fund managed by Stiltsville Capital, which focuses on acquiring and creating long-term value.

7. Multi-Family Apartment Investments: Scaling Up with Residential Assets


Moving beyond smaller properties, multi-family apartment investments represent a significant step up in scale. This category includes properties with five or more units, from urban walk-ups to sprawling suburban complexes.


How It Generates Returns


  • Current Income: The primary return driver is the aggregate net operating income (NOI) from tenant rents, which can provide consistent distributions to investors.

  • Capital Appreciation: Value is created through market rent growth and strategic operational improvements (a "value-add" plan), such as renovating units to achieve higher rents. This directly increases the property's NOI and thus its valuation.


Investor Profile & Suitability


Multi-family investing attracts those looking for a blend of stability and growth. It is ideal for accredited investors participating in syndicated deals or family offices acquiring assets directly.


Investor Take: Multi-family properties offer diversification within a single asset—the vacancy of one unit has a far smaller impact than in a single-family home. The ability to achieve economies of scale in management can lead to higher operating margins. For passive investors, participating in a professionally managed syndication provides access to these benefits without the day-to-day management burden.

8. Land and Development Investing: Creating Value from the Ground Up


At the most fundamental level is land and development investing. This involves acquiring raw land with the intent to create value through entitlement, infrastructure improvements, and vertical construction. This strategy represents the ultimate in value creation, transforming empty parcels into productive assets.


How It Generates Returns


  • Forced Appreciation and Development Profit: The core return driver is the significant increase in value created by taking a parcel through the entitlement and development process. The profit is the difference between the total project cost (land, soft costs, hard costs) and the final sale price or stabilized value. When embarking on larger projects, understanding how to finance them is crucial, for example, by securing property development loans.


Investor Profile & Suitability


Land and development is best suited for sophisticated, patient investors with a high tolerance for risk and a long investment horizon. It requires significant upfront capital with no cash flow for several years.


Advanced Lens: Development offers the highest potential returns (Opportunistic strategy) but also carries the highest risk, including entitlement risk (securing permits), construction delays, and market cyclicality. For accredited investors, partnering with an experienced sponsor on a development project can provide access to these outsized returns while mitigating execution risk through the sponsor's specialized knowledge and operational track record.

9. Short-Term Rental (Vacation Rental) Properties: The Hospitality Hybrid


A dynamic strategy is owning short-term rental (STR) properties. This involves acquiring residential assets and leasing them on a nightly or weekly basis through platforms like Airbnb or VRBO. This model blends real estate ownership with active hospitality management.


A cozy vacation rental living room with a couch, plants, books, and luggage by the door.


How It Generates Returns


  • Current Income: Revenue is generated from guest bookings. Net operating income can be substantial but is often more variable and seasonal than long-term rental income.

  • Capital Appreciation: Similar to other residential assets, the property is expected to appreciate in value over time, especially in high-demand tourist destinations.


Investor Profile & Suitability


This approach is ideal for entrepreneurial investors who enjoy the hospitality business. It demands a highly active management role, from guest communication to pricing strategy.


Investor Take: Short-term rentals offer the potential for superior cash flow but come with higher operational intensity, revenue volatility, and significant regulatory risk from local governments. This contrasts with a passive investment in a large-scale hospitality fund, which benefits from professional brand management and economies of scale.

10. Lease Options and Owner Financing: Creative Deal Structures


Beyond traditional acquisitions, creative financing represents a sophisticated category among the types of real estate investment. Lease options (rent-to-own) and owner financing (seller-held notes) are two techniques used to create deals where conventional lending might not be feasible.


How It Generates Returns


  • Layered Income Streams: In a lease option, the investor collects monthly rent, a non-refundable option fee upfront, and often a rent credit. For owner financing, the return comes from the interest income paid on the private loan.

  • Capital Appreciation & Pre-Set Gains: The investor benefits from the property's appreciation. In a lease option, the future purchase price is locked in upfront, allowing the investor to capture the spread if the tenant-buyer exercises their option.


Investor Profile & Suitability


These strategies are for investors with a strong understanding of real estate law, financial structuring, and diligent underwriting. It requires a hands-on approach to crafting legally sound contracts.


Investor Take: Creative financing can generate above-market returns by providing a pathway to homeownership for buyers outside the traditional financing box. However, they introduce complexity and require meticulous legal documentation. These bespoke deals stand in contrast to participating passively in a larger, institutional fund where deal sourcing and structuring are handled entirely by the general partner.


Investor Checklist: Questions to Ask Any Real Estate Sponsor


Before allocating capital, especially in a passive private deal, your diligence should be thorough. Here are essential questions to ask a sponsor like Stiltsville Capital:


  1. Track Record: Can you provide a detailed history of your realized deals, including original pro forma vs. actual returns?

  2. Alignment of Interests: How much of your own capital (GP co-invest) is in this deal? How is your compensation (the "promote") structured in the waterfall?

  3. Business Plan: What is the specific value-add or development plan? What are the key milestones and the anticipated hold period?

  4. Market Assumptions: What are your assumptions for rent growth, exit cap rate, and interest rates? How were these determined?

  5. Risk Mitigation: What are the primary risks for this project, and what is your plan to mitigate them? What does the downside scenario look like?

  6. Reporting & Communication: What is the frequency and format of investor reporting and communication?

  7. Fees: Can you provide a transparent breakdown of all fees (acquisition, asset management, disposition, etc.)?


Choosing Your Strategy: How to Align with Your Portfolio Goals


Navigating the landscape of real estate is akin to charting a course through varied geography. Each of the types of real estate investment we’ve explored represents a distinct territory with its own rules, risks, and potential rewards. There is no single "best" investment; there is only the best investment for you, dictated by your capital, risk tolerance, time horizon, and desired level of involvement.


The options detailed create a spectrum of engagement. On one end, you have active roles like wholesaling or managing a short-term rental, which are more akin to operating a business. On the other end, vehicles like REITs and private syndications offer a hands-off approach.


Synthesizing Your Investment Thesis


As you reflect on these options, the path forward involves aligning your choice with a clear strategic approach:


  • Risk vs. Return: Are you aiming for the steady cash flow of a stabilized Core asset, or the higher potential upside of an Opportunistic development deal?

  • Active vs. Passive: Do you have the time and expertise to manage an asset yourself? Or does your professional life demand a passive allocation where an expert sponsor handles the heavy lifting?

  • Liquidity Needs: How soon might you need to access your capital? Private placements are inherently illiquid (5-10 year holds), while public REITs offer daily liquidity. This single factor can immediately narrow your viable options.


Mastering these concepts transforms you from a passive observer into an active architect of your financial future. It allows you to ask sponsors the right questions and build a diversified portfolio that is resilient across market cycles. A well-structured allocation to real estate provides portfolio diversification, an effective hedge against inflation, and significant tax advantages, making it a cornerstone of sophisticated wealth preservation and growth strategies.


Take the Next Step


Ready to translate knowledge into action? If you are an accredited investor seeking to access institutional-quality, passive real estate opportunities, consider partnering with an experienced sponsor. Stiltsville Capital LLC specializes in identifying and managing value-add and opportunistic investments across resilient sectors, providing our partners with a disciplined path to portfolio diversification and growth.


Schedule a confidential call with Stiltsville Capital to discuss how our strategy aligns with your investment objectives.


Disclaimer: Information presented is for educational purposes only and does not constitute an offer to sell or a solicitation of an offer to buy securities. Any offering is made only through definitive offering documents and is available solely to investors who meet applicable suitability standards, including “Accredited Investor” status under Rule 501 of Regulation D. Investments in private real estate involve risk, including loss of capital, illiquidity, and no guarantee of distributions. Past performance is not indicative of future results.


Corporate Office

30 West Mashta Drive | Suite 400

Key Biscayne, FL 33149​​

Tel: 786.316.9840

© 2026 Stiltsville Capital LLC

Stiltsville Capital LLC_logo_black

Disclosures

​​​Success Stories and Testimonials are intended to demonstrate our firms professional experience and history of providing exceptional service to their clients and reflect the collective experience of Stiltsville Capital, LLC's Principals and Team members and may include transactions/clients they have worked with directly at previous firms.

Stiltsville Capital, LLC and its affiliates do not provide tax or legal advice. Information contained on this website is provided for educational and illustrative purposes only and cannot be relied upon to avoid tax penalties. Please consult your tax and legal advisors to determine how this information may apply to your own situation. Whether any planned tax result is realized by you depends on the specific facts of your own situation at the time your tax return is filed. 


Real estate and private equity investments have special risks, including possible illiquidity of the underlying properties, credit risk, interest rate fluctuations, and the impact of varied economic conditions and may not be suitable for all investors.

bottom of page