top of page
Search

Reading Time 8 min | Good for: Novice Investors (A), Informed Principals (B)


At its core, a 1031 exchange is a remarkably powerful tool for wealth creation. Mandated by Section 1031 of the Internal Revenue Code, it lets you sell an investment property, roll the entire sale amount into a new one, and defer the capital gains tax bill. You’re essentially keeping your full investment principal working for you, rather than carving out a significant chunk for the IRS.


TL;DR: The 1031 Exchange in a Nutshell


  • Defer, Don't Pay: A 1031 exchange allows you to postpone paying capital gains tax on the sale of an investment property by reinvesting the proceeds into a new "like-kind" property.

  • Strict Rules Apply: You must use a Qualified Intermediary (QI) to handle the funds and adhere to strict deadlines: 45 days to identify replacement properties and 180 days to close on one.

  • Boost Your Buying Power: By deferring taxes, you can reinvest 100% of your proceeds, enabling you to acquire larger or better-performing assets and compound your wealth faster.

  • Ideal for Strategic Shifts: This tool is perfect for investors looking to trade up, diversify into new asset classes (e.g., from multifamily to a passive DST), or reposition their portfolio without a costly tax event.


Your Quick Guide to the 1031 Exchange Process


For serious investors and family offices, the 1031 exchange is one of the most effective strategies for preserving and growing wealth in real estate. Instead of a profitable sale triggering a massive tax event, it provides a clear path to roll those gains forward.


Think of it as securing an interest-free loan from the government on your tax liability. That deferred capital dramatically boosts your purchasing power for the next deal, a concept that has been a pillar of smart real estate strategy for decades. According to a 2021 analysis by the National Association of Realtors, the liquidity provided by 1031 exchanges is a critical market driver.


This section is your high-level roadmap. We’ll walk through the critical milestones, from the moment you decide to sell until you're closing on the new asset. Getting this framework down is the first step to executing a smooth, compliant exchange.


Aerial view of a complex highway interchange, symbolizing the structured process of a 1031 exchange.


The Key Players and Timelines


Two things are absolutely non-negotiable in a 1031 exchange: bringing in a Qualified Intermediary (QI) and sticking to the iron-clad timelines. No exceptions.


  • The Qualified Intermediary (QI): This is critical—you cannot touch the sale proceeds yourself. A QI is a neutral third party who must hold the funds between selling your old property (the "relinquished" property) and buying your new one (the "replacement" property). You absolutely must engage a QI before your sale closes.

  • The Timelines: The clock starts ticking the moment you close the sale on your relinquished property. From that day, you have just 45 days to formally identify potential replacement properties and a total of 180 days to close on one or more of them. These deadlines are absolute and they run concurrently.


Investor Takeaway: That 45-day identification window is where most exchanges fall apart. A successful 1031 requires a clear acquisition strategy. You should be actively hunting for replacement properties long before your current asset is even under contract.

The 1031 Exchange Key Stages and Timelines


This table summarizes the critical milestones, deadlines, and key players involved in a successful 1031 exchange process.


Stage

Key Action

Critical Deadline

Primary Responsible Party

Stage 1: Preparation

Engage a Qualified Intermediary (QI) and add 1031 exchange language to the sales contract for your current property.

Before closing on the relinquished property.

You (the Exchanger) & your legal counsel.

Stage 2: Sale & Identification

Close the sale of the relinquished property. The QI receives and holds the proceeds directly from the closing agent.

Identify potential replacement properties in writing to your QI within 45 calendar days from the closing date.

You (the Exchanger).

Stage 3: Acquisition

Enter into a contract for a replacement property that was on your 45-day identification list.

Complete the purchase and close on the replacement property within 180 calendar days from the original sale date.

You (the Exchanger) & your QI.

Stage 4: Completion

The QI transfers the exchange funds to the seller of the replacement property to complete the purchase. The exchange is now finalized.

Must be completed within the 180-day window.

Qualified Intermediary (QI).


Having this timeline in mind helps you prepare for each step, ensuring you stay compliant and on track from start to finish.


Getting a Grip on the Core 1031 Rules


Before you even think about listing your property, you absolutely have to understand the ground rules of a 1031 exchange. This isn't just a suggestion; it's the difference between deferring your taxes successfully and getting hit with an ugly, unexpected bill from the IRS.


The whole point of a 1031 exchange is to keep your investment rolling. The IRS lets you postpone the tax hit because you're swapping one investment property for another, continuing your investment journey. The rules we follow today were largely shaped by the 1979 Starker court case, which opened the door for delayed exchanges. In response, Congress codified the strict timelines in 1984: 45 days to identify and a total of 180 days to close.


The "Like-Kind" Property Rule (It's Broader Than You Think)


This is probably the most misunderstood part of the entire process. Novice investors often get tripped up, thinking they must swap an apartment building for another, nearly identical apartment building.


Thankfully, the rule is much more flexible—and powerful.


"Like-kind" refers to the nature or character of the property, not its grade or quality. As long as you're swapping any real property held for productive use in a trade or business or for investment for another real property to be held for the same purpose, you're generally in the clear.


Here are a few real-world examples of what a like-kind exchange can look like:


  • Selling a single-family rental and buying a small commercial office building.

  • Trading a piece of raw land for a portfolio of retail properties.

  • Exchanging a multifamily complex for a fractional interest in a large data center via a Delaware Statutory Trust (DST).


Novice Lens: What is "Boot"?"Boot" is a simple term for any non-like-kind property received in an exchange. It won't kill the whole deal, but you will pay taxes on it. It usually shows up in two ways:* Cash Boot: Any cash you walk away with. If your Qualified Intermediary gives you even $1 from the sale proceeds, that dollar is taxable.* Mortgage Boot (Debt Relief): This happens when the debt on your new property is less than the debt you paid off on the old one. If you paid off a $1M mortgage but only took on a $900,000 loan for the new place, you've received $100,000 in "mortgage boot," which is taxable.

The bottom line is that your primary home, a fix-and-flip project, or a personal vacation house are off the table for a 1031. The IRS cares about your intent—the properties must be genuine investments.


Reinvesting Equity and Replacing Debt


To pull off a 100% tax-deferred exchange, you have to nail two non-negotiable financial rules. Just think of them as the "equal or greater" tests.


1. Reinvest All Your Equity: The purchase price of your new property must be equal to or greater than the net sale price of the property you sold. If you sell a building for $2 million (after closing costs), you must buy at least $2 million worth of new real estate. Any cash you pocket is considered taxable boot.


2. Replace All Your Debt: You also need to acquire new debt that's equal to or greater than the mortgage you paid off. If you don't, the shortfall is considered mortgage boot and gets taxed.


Let's run through a quick scenario.


You sell a property for $3,000,000. You pay off the $1,500,000 mortgage, leaving $1,500,000 in cash equity held by your QI.


To defer all your taxes, your new property needs to check two boxes:


  • The purchase price must be at least $3,000,000.

  • The new mortgage must be at least $1,500,000.


If you bought a $3,000,000 property but only took out a $1,200,000 loan, you'd have $300,000 of taxable mortgage boot. Getting these numbers right is absolutely crucial.


A Step-by-Step Playbook for Your 1031 Exchange


Alright, you understand the rules. Now, let's get into the practical, step-by-step playbook for pulling off a successful 1031 exchange. Think of it as a clear sequence of strategic moves, where each step builds on the last.


The absolute first thing you must do—and this is non-negotiable—is to bring a Qualified Intermediary (QI) onto your team. This has to happen before you close the sale of your current ("relinquished") property. The QI is a neutral third party who will hold your sale proceeds. This is crucial because it prevents you from having "constructive receipt" of the funds. If that cash touches your bank account, even for a second, the exchange is busted and the tax deferral vanishes.


To kick things off smoothly, you’ll want to prepare your relinquished property for sale to attract the best offers. Once it sells, the money goes straight from the closing agent to your QI. The moment that happens, your two critical 1031 clocks officially start ticking.
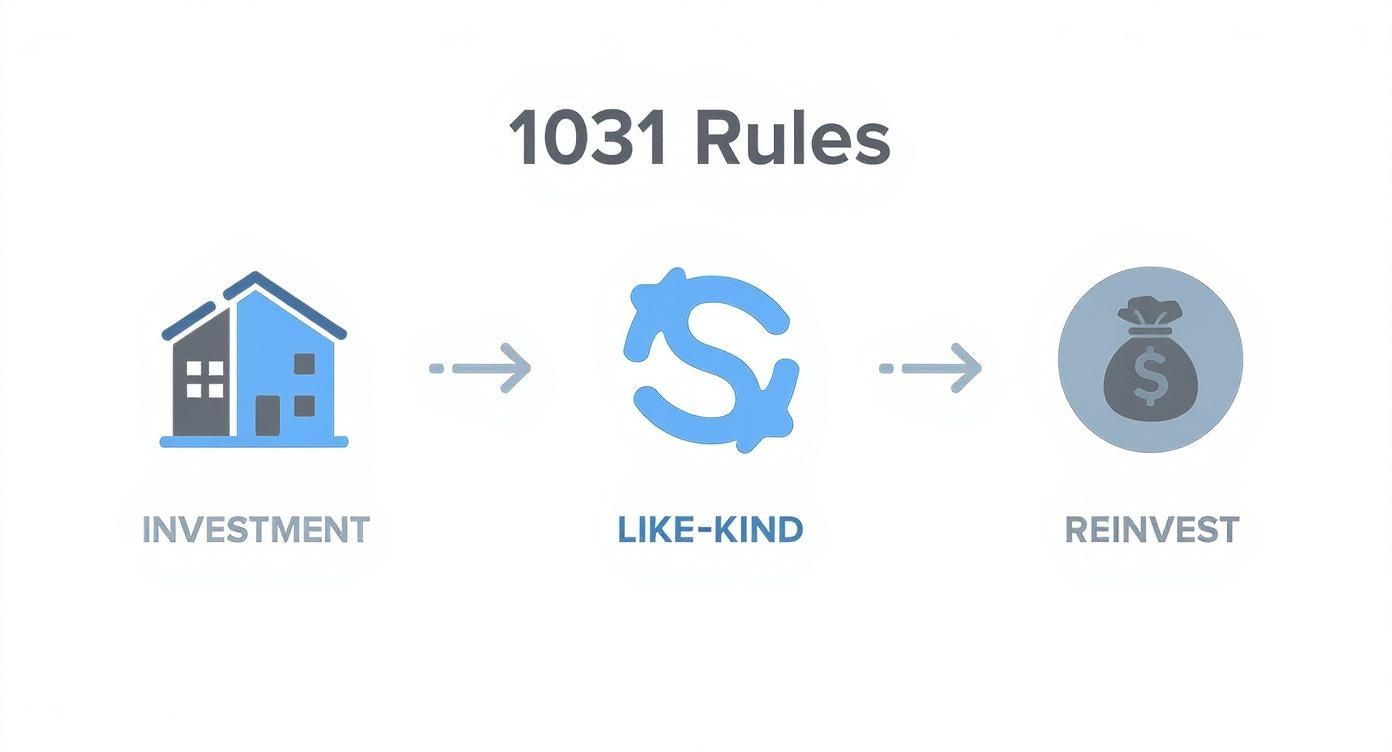

Infographic about how to do a 1031 exchange


This visual reinforces how linear the process is. You have to nail each step in order to keep your transaction's tax-deferred status intact.


The 45-Day Identification Sprint


The clock is ticking. From the day your sale closes, you have exactly 45 calendar days to officially identify potential replacement properties. There are no extensions. This identification needs to be in writing, signed by you, and sent to your QI before midnight on day 45.


The IRS gives you three ways to do this. You only need to follow one of these rules:


  • The Three-Property Rule: This is the one most investors use. It's simple. You can identify up to three properties of any value. You don't have to buy all three; it just gives you options in case your top pick doesn't work out.

  • The 200% Rule: Need more options? You can identify more than three properties, but the total fair market value of all identified properties can't be more than 200% of what you sold your property for. Sell a $2 million building, and you can identify five properties as long as their combined value is $4 million or less.

  • The 95% Rule: This one is rare and usually only comes into play for large, complex portfolio deals. You can identify as many properties as you want, but you must ultimately purchase at least 95% of the total value of everything you identified.


Investor Takeaway: The 45-day window is a sprint, not a marathon. Pro investors start their hunt long before their old property even has a buyer. Have a short list of targets ready to go. Don't wait for the clock to start before you begin looking.

The 180-Day Acquisition Clock


Your second critical deadline is the 180-day acquisition period. This clock starts on the exact same day as the 45-day window—they run concurrently. You must close the deal and take title to one or more of your identified properties within this 180-day timeframe.


This is your window for conducting due diligence, arranging financing, and getting to the closing table. Your QI is essential here, as they'll coordinate with the closing agent to wire your exchange funds directly to the seller of your new property. Again, you can't touch the money yourself.


For investors facing a tight deadline or seeking a more passive investment, there are other powerful solutions. One is the Delaware Statutory Trust (DST), which qualifies as a like-kind replacement and can often be acquired very quickly.


Deal Lens Example: A Practical Exchange Scenario


Let's put this all together with an illustrative example.


An investor has owned a 20-unit multifamily property for a decade. She sells it for a net price of $5 million and pays off her $2 million mortgage. Her QI is now holding $3 million in cash.


Her goal is to diversify and shift into a more passive management role.


  • Day 1: Her multifamily sale closes. The 45-day and 180-day clocks begin.

  • Day 30: Using the Three-Property Rule, she identifies two potential assets: 1. A triple-net (NNN) lease retail property with a national pharmacy tenant, listed for $3.5 million. 2. An interest in a Delaware Statutory Trust (DST) that holds a portfolio of medical office buildings, valued at $2.5 million.

  • Day 120: After thorough due diligence, she closes on the pharmacy property. She uses her $3 million in exchange funds from the QI and secures a new $500,000 loan. Because the new property value ($3.5M) and new debt ($0.5M) are not equal to or greater than the old property's value ($5M) and debt ($2M), she would have significant taxable boot.

  • A Better Strategy: She acquires both identified properties. She uses her $3 million from the QI and obtains a new $3 million loan to purchase both assets for a total of $6 million. This transaction meets the "equal or greater" tests for both value and debt, allowing for a 100% tax-deferred exchange.


By using the 1031 exchange, she masterfully deferred a massive tax bill. More importantly, she swapped one management-heavy asset for two high-quality, passive income streams, perfectly aligning with her investment goals.


Advanced Strategies and Common Pitfalls to Avoid


Once you master the standard delayed exchange, you can explore more sophisticated structures that offer greater flexibility. These aren't your everyday exchanges; they’re designed for specific situations, helping savvy investors navigate tricky market conditions.


Of course, with more complexity comes a higher risk of error. This section dives into some powerful alternatives and highlights the common traps that can derail your plans.


Exploring Advanced Exchange Structures


Ever find the perfect replacement property before you're ready to sell your current one? It’s a common problem with a solution.


A Reverse Exchange is built for this scenario. A specialized entity, an Exchange Accommodation Titleholder (EAT), acquires and "parks" the new property on your behalf. This lets you lock down your target asset first, giving you up to 180 days to sell your old property and complete the exchange.


Another powerful tool is the Improvement Exchange (or Construction Exchange). This lets you use your exchange funds not just to buy a property but also to pay for construction or major renovations. The key condition is that the improvements must be completed within the 180-day exchange window, making it ideal for value-add investors.


The Delaware Statutory Trust (DST) for Passive Investors


If you’re tired of the hands-on grind of property management, the Delaware Statutory Trust (DST) is a game-changer. The IRS officially recognizes an interest in a DST as "like-kind" property, making it a valid replacement asset for a 1031 exchange.


With a DST, you can roll your exchange proceeds into a professionally managed portfolio of institutional-grade real estate. It's an excellent way to diversify across properties, asset classes, and geographies. For a deeper dive, see your guide to 1031 exchange funds for passive real estate investing.


Investor Takeaway: Advanced structures like Reverse and Improvement exchanges offer incredible flexibility, but they involve complex legal and financial footwork. These are not DIY projects—you absolutely need an experienced QI and legal team to execute them correctly.

Common 1031 Exchange Pitfalls and How to Avoid Them


Knowing the rules is one thing; navigating the real-world pressure of a live deal is another. Here are some of the most frequent errors and how to proactively mitigate them.


  • Risk: Missing the 45-Day Identification Deadline * Failing to submit a signed, written identification list to your QI by midnight on day 45 instantly kills the exchange, triggering full tax liability. * Mitigation: Start hunting for replacement properties months before you list your current one. Have a pre-vetted list of potential targets—with backups—ready to go on day one.

  • Risk: Constructive Receipt of Funds * If you or your agent (like your personal attorney) touch the sale proceeds, even for a moment, the exchange is void. * Mitigation: Engage a reputable Qualified Intermediary (QI) before you close on the property you're selling. Ensure the closing agent is instructed to wire funds directly to the QI.

  • Risk: Improperly Identifying Properties * Not following the Three-Property, 200%, or 95% rules to the letter will invalidate your ID list, leaving you with no legitimate replacement options after day 45. * Mitigation: Work closely with your QI to review and confirm your identification list before you submit it. Double-check every address and property description for accuracy.

  • Risk: Failing to Replace Debt (Mortgage Boot) * If you acquire a replacement property with less debt than the property you sold, the difference is taxable "mortgage boot." * Mitigation: Structure your financing so the new loan is equal to or greater than the debt you paid off. Model this out with your advisor early in the process.


Proactive planning and a strong advisory team are your best defense against these costly mistakes. For more insights, you can explore the latest real estate investment articles from other industry experts.


The Real Power of a 1031 Exchange: Compounding Your Wealth


Let's move beyond the rules for a moment. The real magic of a 1031 exchange isn’t just about deferring a tax bill—it’s about fundamentally changing your wealth-building trajectory.


By deferring capital gains, you reinvest your entire pre-tax profit. This is the difference between rolling 100% of your proceeds into the next deal versus perhaps 70% or 80% after taxes. That extra capital becomes a powerful engine for compounding growth, letting you scale up into bigger or better properties with every transaction.


A stylized chart showing an upward-trending arrow made of stacked coins, illustrating financial growth and compounding.


Why Tax Deferral Is a Game-Changer


A 1031 exchange provides, in effect, an interest-free loan from the government on your tax liability. It’s capital you can put to work right now to generate more returns.


With each successive exchange, the effect snowballs. You're not just deferring gains from your last sale but potentially the locked-in gains from several properties sold over many years. This allows your entire portfolio to grow on a much larger, pre-tax base. It also gives you incredible strategic flexibility to reposition your portfolio without taking a huge tax hit.


Keeping the Market Moving


From a macroeconomic perspective, the 1031 exchange is a critical lubricant for the real estate market. It encourages property owners to sell and reinvest rather than holding assets indefinitely simply to avoid taxes. This constant flow of transactions provides essential liquidity.


The economic impact is massive. One report from the National Association of Realtors suggests that without this provision, commercial property prices might need to drop by 8% to 12% to deliver the same returns. You can see the full analysis on the economic effects of 1031 exchanges at NAR.realtor.


Insight Edge: A Tale of Two Investments (Illustrative)Here’s a simplified comparison to show exactly what’s at stake.Scenario 1: Selling Without an Exchange* Sale Price: $2,000,000* Adjusted Cost Basis: $1,000,000* Capital Gain: $1,000,000* Estimated Taxes (25% blended rate): $250,000* Capital Available to Reinvest: $1,750,000Scenario 2: Selling With a 1031 Exchange* Sale Price: $2,000,000* Taxes Deferred: $250,000* Capital Available to Reinvest: $2,000,000The 1031 investor has an extra $250,000 working for them from day one. If that capital earns a 7% annual return, that’s an additional $17,500 in your pocket every year. This is why we see the 1031 as a capital multiplier, not just a tax tool. It also works hand-in-glove with other strategies, which you can explore by unlocking the tax shield of depreciation for real estate investors.

Questions to Ask Your Advisor Before Starting a 1031 Exchange


  1. Is my current property eligible for a 1031 exchange based on its use?

  2. What is my realistic net sale price and total gain after accounting for depreciation recapture?

  3. Based on my goals, what types of replacement properties should we target?

  4. Can you recommend several reputable Qualified Intermediaries for me to interview?

  5. What is our contingency plan if our primary replacement property target falls through?

  6. How will we model the debt and equity requirements for the replacement property to ensure a 100% tax-deferred exchange?

  7. What are the total estimated costs for the exchange, including QI fees, legal, and advisory?

  8. Are there passive options like a Delaware Statutory Trust (DST) that might fit my situation?

  9. What are the reporting requirements for the exchange on my next tax return?

  10. What happens to my deferred tax liability upon my death? (Hint: step-up in basis).


Frequently Asked Questions About 1031 Exchanges


Even the most seasoned investors have questions when it comes to the nitty-gritty of a 1031 exchange. Let's tackle some of the most common ones.


Can I use a 1031 exchange for my primary residence or a vacation home?


That’s an immediate "no" for your primary residence. Section 1031 is strictly for properties held for investment or used in a trade or business. Your main home receives its own tax treatment under Section 121, which allows for a capital gains exclusion of up to $250,000 for single filers and $500,000 for married couples.


A vacation home is a gray area. It can qualify, but only if you treat it almost exclusively as a rental property. IRS "safe harbor" guidelines generally limit personal use to no more than 14 days a year or 10% of the days it was rented.


What happens if I cannot find a replacement property within 45 days?


This is the scenario every investor dreads. If you don’t formally identify replacement properties with your Qualified Intermediary (QI) by midnight on the 45th day, the exchange fails. Period.


Once that deadline passes, your QI is required to release your funds back to you. The moment that happens, your original sale becomes a standard, fully taxable transaction. This is precisely why having a short list of potential replacement properties before you sell is a game-changer.

What is boot and how is it taxed?


"Boot" is any non-like-kind property you receive in an exchange. It won't invalidate your entire 1031, but any boot you receive is taxable.


It comes in two forms:


  • Cash Boot: Any sale proceeds that end up in your pocket.

  • Mortgage Boot: This happens when the mortgage on your new property is less than the mortgage you paid off on the old one.


The value of any boot is generally taxed as capital gains. To achieve a 100% tax-deferred exchange, you must reinvest all your cash proceeds and take on an equal or greater amount of debt.


Executing a 1031 exchange is a powerful move, but it requires careful planning and expert guidance. Well-structured real estate assets, acquired through thoughtful strategies like a 1031 exchange, can be a prudent and resilient component of a long-term wealth strategy. While all investments carry risk, a disciplined approach helps mitigate them.


Ready to explore how a 1031 exchange can strategically enhance your real estate portfolio? The team at Stiltsville Capital can help you navigate the process and identify institutional-quality replacement properties that align with your long-term wealth goals.


Information presented is for educational purposes only and does not constitute an offer to sell or a solicitation of an offer to buy securities. Any offering is made only through definitive offering documents (e.g., private placement memorandum, subscription agreement) and is available solely to investors who meet applicable suitability standards, including “Accredited Investor” status under Rule 501 of Regulation D. Investments in private real estate involve risk, including loss of capital, illiquidity, and no guarantee of distributions. Past performance is not indicative of future results. Verification of accredited status is required for participation in Rule 506(c) offerings.


Reading Time: 7 min | Good for: Novice (A), Informed (B)


In the world of real estate investing, the capitalization rate, or cap rate, is your go-to metric for quickly sizing up a property's potential return. It cuts through the noise of financing to give you a clean look at the income it generates. Think of it as the foundational tool for any serious analysis of an income-producing property.


TL;DR: What You Need to Know


  • What it is: A cap rate shows the potential unleveraged annual return on a real estate investment, calculated as Net Operating Income (NOI) / Property Value.

  • Why it matters: It provides a standardized, apples-to-apples way to compare the initial return of different properties, regardless of how they are financed.

  • What it signals: A low cap rate typically indicates lower risk and higher investor demand (think a new building in a prime city), while a high cap rate suggests higher risk or a potential value-add opportunity.

  • Its limits: A cap rate is just a snapshot in time. It doesn't account for future rent growth, capital expenditures, or the powerful impact of leverage.


Getting to the Core of Cap Rate


At its heart, the cap rate answers a simple but powerful question: "Based on the price, what is the raw, unleveraged annual return this property is throwing off?"


It works a lot like the dividend yield on a stock. It boils down a property's performance into a single, standardized percentage. This makes it incredibly useful for comparing different investment opportunities on an apples-to-apples basis, showing you which one might give you a better initial return for every dollar you put in.


The Simple Math Behind It


The formula itself is refreshingly straightforward, built on just two key numbers:


  • Net Operating Income (NOI): This is the engine of your property's return. You find it by taking all the income (rent, fees, etc.) and subtracting all the day-to-day operating costs—think property taxes, insurance, and maintenance. The key thing to remember is that NOI is calculated before you factor in any mortgage payments or income taxes.

  • Property Value (or Purchase Price): This is simply what the property is worth on the market, or the price you're actually paying for it.


The formula ties these two together beautifully:


Cap Rate = Net Operating Income (NOI) / Property Value

So, if a building generates $80,000 in annual NOI and you buy it for $1,000,000, you’re looking at an 8% cap rate ($80,000 ÷ $1,000,000). It’s that simple. This little percentage is the starting point for almost every serious commercial real estate deal.


Cap Rate Formula Components Explained


The formula is simple, but each part tells a critical story about the investment's health and potential.


Component

What It Is

Why It Matters for Investors

Net Operating Income (NOI)

The property's total annual income minus all operating expenses (but before debt service or taxes).

It’s the purest measure of a property's profitability. A higher, stable NOI is a sign of a healthy, well-managed asset.

Property Value

The current market price or the agreed-upon purchase price of the asset.

This is your "all-in" cost. The price you pay directly influences your initial return, so getting it right is crucial.

Cap Rate

The percentage return calculated by dividing NOI by the property value.

This is your quick-glance metric for comparing risk and return between different properties and markets.


Understanding these pieces is the first step toward making smarter, more confident investment decisions.


For a deeper dive into how this all comes together, this guide on What Is Cap Rate In Real Estate Investing is a great resource.


How to Properly Calculate Net Operating Income


The cap rate formula is wonderfully simple, but its results are only as good as the numbers you plug into it. The most important piece of that puzzle—the one that really tells you about a property's financial health—is its Net Operating Income (NOI). Getting this number right isn't just important; it's everything.


Think of NOI as the property's pure, unvarnished annual profit before you factor in things like mortgage payments or income taxes. It’s the truest measure of how the asset performs as a business, all on its own. For any serious investor, nailing this calculation is step one.


Start with Total Potential Income


First, you have to figure out the Gross Potential Income (GPI). This is the absolute maximum cash a property could bring in over a year if every single unit was 100% occupied and every tenant paid their rent in full, on time. It's the "best-case scenario" number.


Of course, no property actually operates at 100% perfection. To get a number that reflects the real world, you have to account for a few realities.


Adjust for Vacancy and Credit Losses


Next, you'll subtract an allowance for vacancy and credit loss. This is a buffer, usually a percentage of the GPI (think 5-10%), that accounts for the inevitable empty units and tenants who don't pay. Once you subtract this, you’re left with the Effective Gross Income (EGI), a much more honest picture of the money actually hitting the bank.


Why It Matters for Investors: A seller might show you a proforma with a super-low vacancy rate to make the numbers look better. This can seriously inflate the NOI and the property's valuation. Always, always double-check this against what’s actually happening with similar properties in the area.

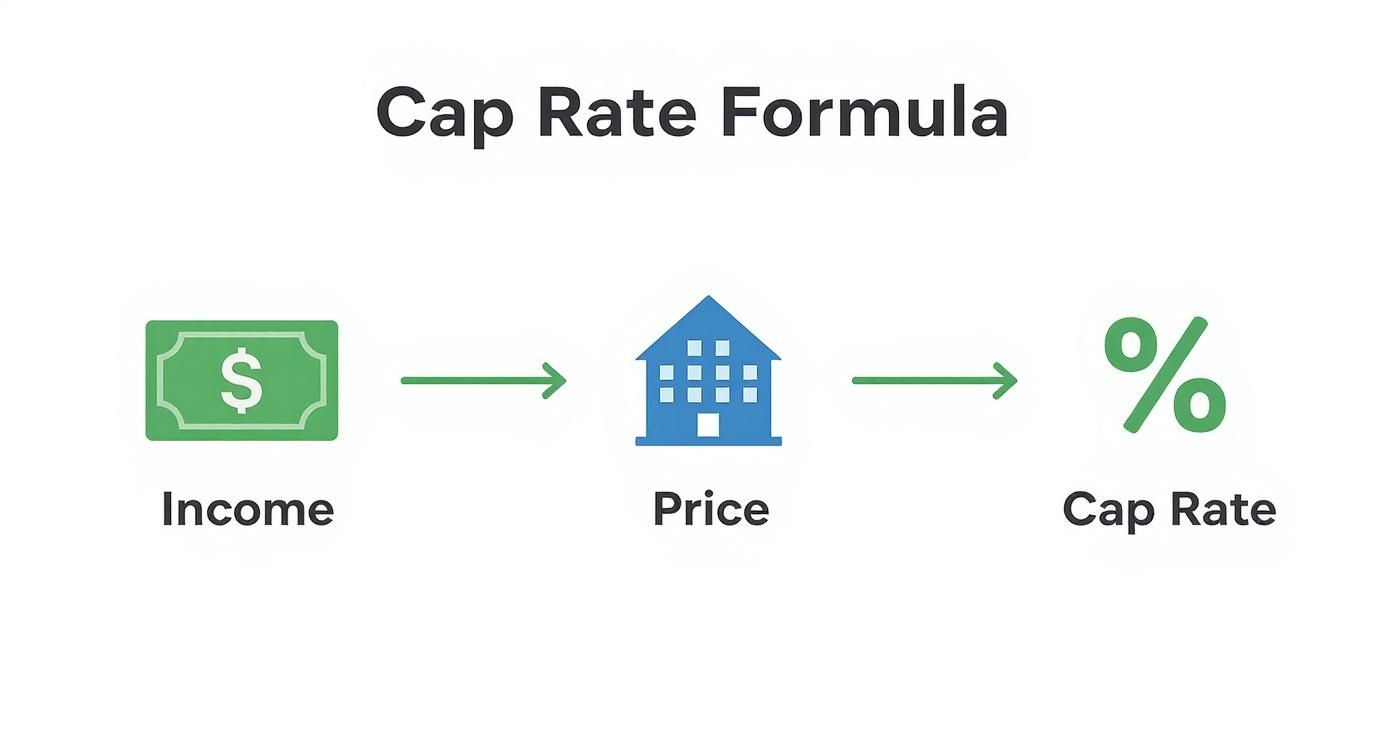
This graphic breaks down how income and price come together to give you the cap rate.


Infographic about what does cap rate mean in real estate


As you can see, the property's income is the direct input that, when divided by its price, produces the cap rate.


Deducting True Operating Expenses


Now, from your Effective Gross Income, it's time to subtract all the cash expenses needed to keep the property running day-to-day. These are the costs you'd have whether you owned the property free-and-clear or had a mortgage on it.


Common operating expenses include things like:


  • Property Taxes: A big, unavoidable cost every year.

  • Property Insurance: Essential coverage for liability, fire, and other risks.

  • Utilities: Any costs not paid directly by tenants, like electricity for common areas or water.

  • Repairs & Maintenance: The ongoing costs for landscaping, plumbing fixes, HVAC tune-ups, and general upkeep.

  • Management Fees: What you pay a property manager or allocate for your own management services.


What Not to Include in the Calculation


This is where a lot of new investors get tripped up and completely distort their NOI. The following items should never be included when you're calculating operating expenses for NOI:


  1. Debt Service: Your mortgage payments (both principal and interest) are financing costs, not operating costs.

  2. Capital Expenditures (CapEx): Big-ticket items that extend the property's life—like a new roof or repaving the parking lot—are handled separately.

  3. Depreciation: This is a "paper" expense for tax purposes; no actual cash leaves your pocket.

  4. Income Taxes: These are personal to the investor, not tied to the property's performance.


By carefully tallying up your real income and subtracting only the true operating expenses, you'll land on the Net Operating Income. For a deeper dive with more examples, check out our guide on how to find Net Operating Income—it's a skill every real estate investor needs to master. This number is the rock-solid foundation for your entire cap rate analysis.


Decoding What High and Low Cap Rates Signal


Once you've run the numbers and calculated the cap rate, you've officially moved from simple math to market psychology. That single percentage is a powerful signal, telling a story about risk, investor demand, and how the market feels about an asset's future. Learning to read that story is the key to making smart investment decisions.


Think of it as a see-saw relationship between price and return. When investors are lining up for a property and feel confident in its future income, they're willing to pay more for it. That higher price pushes the cap rate down. On the flip side, if a property's income stream feels a bit shaky, buyers will demand a higher potential return to make up for that risk. That means a lower purchase price and, consequently, a higher cap rate.


Graph showing the relationship between risk and cap rate


What a Low Cap Rate Tells You


A low cap rate is often a property's badge of honor. It usually means the asset is considered a high-quality, lower-risk investment that everyone wants a piece of.


  • High Demand: More investors are competing for it, which naturally drives the price up.

  • Prime Location: The property is likely in a strong, stable market with solid economic footing.

  • Stable Tenancy: It probably has great, long-term tenants with a proven track record of paying on time.

  • Lower Perceived Risk: Investors feel the income is safe and predictable, so they don't need a big risk premium to be convinced.


For example, a shiny new apartment building in a hot market like Austin or Miami will often trade at a low cap rate. Why? Because buyers are confident it will attract high-paying tenants for years to come.


What a High Cap Rate Signals


In contrast, a higher cap rate is like a flashing light. It’s signaling either greater risk or a major opportunity for a sharp operator who knows what they're doing.


Investor Takeaway: A high cap rate isn't automatically "bad," and a low one isn't always "good." It’s simply the market’s price tag for risk. The real question is whether you're being paid enough to take on the specific risks tied to that property.

A higher cap rate might point to a few things:


  • Higher Risk: The property could be in a less desirable area, have a laundry list of deferred maintenance, or be struggling with high vacancy.

  • Value-Add Potential: This is where the opportunity lies. The property might just be poorly managed or under-rented, giving an experienced team a clear path to boost the NOI and create serious value.

  • Softer Market: The local economy might not be as strong, creating uncertainty about future rent growth.


Historically, cap rates have always been a barometer for these market dynamics. Properties in high-demand urban centers often trade at cap rates as low as 3% to 5%, reflecting lower risk and higher prices. On the other hand, assets in more challenging areas might have cap rates north of 10%.


Figuring out which high-cap-rate deals are hidden gems versus money pits is a core part of what we do at Stiltsville Capital. For a deeper dive, check out our guide on what makes a good cap rate.


Practical Example: A Tale of Two Properties


Theory is one thing, but let's be real—concepts like this don't truly click until you see them in action with actual numbers. This is where a simple percentage transforms from a piece of jargon into a powerful strategic tool for weighing risk, reward, and opportunity. Let's walk through a practical comparison.


Two different apartment buildings, one modern in a city and one older in a suburb.


Imagine you're an investor with two deals on your desk.


Property A: The Stabilized Core Asset


First up is a Class A apartment building in a prime downtown spot. It's the "greatest hits" of real estate—fully leased with great tenants, needs minimal upkeep, and throws off a steady, predictable income stream.


It’s safe, it’s stable, and other investors are lining up to buy assets just like it. Because of this high demand and low perceived risk, the market has priced this property at a tight 4.5% cap rate.


Property B: The Value-Add Opportunity


Now, look at Property B. This is an older, Class B building in a suburb that's quickly gentrifying. The rents are way below what they should be, and the units are crying out for a modern facelift.


For a savvy investor, this screams opportunity. But the market sees more risk—the renovation budget, the uncertainty of leasing up at higher rates—and prices it accordingly. This property is trading at a much higher 6.5% cap rate, reflecting that risk.


Deal Lens: Property A (Core) vs. Property B (Value-Add)


Here’s an illustrative look at two multifamily assets. It’s a perfect example of how cap rates instantly tell you about the market’s perception of risk and return for a given property.


Metric

Property A (Stabilized Core)

Property B (Value-Add Opportunity)

Net Operating Income (NOI)

$450,000

$450,000

Market Cap Rate

4.5%

6.5%

Implied Property Value (NOI / Cap Rate)

$10,000,000

~$6,923,000


Take a look at that. Even with the exact same starting income, the market values Property A over $3 million higher than Property B. Why? Because its income stream is seen as a much safer bet.


The Investor's Playbook: For Property B, the game isn't just about collecting a 6.5% return. The real strategy is executing a business plan. The new owner will come in, renovate units, tighten up management, and push the Net Operating Income higher. If they successfully increase the NOI to $550,000, the property's value, at that same 6.5% cap rate, would jump to nearly $8.5 million. That's how value-add real estate creates serious equity. Mastering the inputs for these scenarios is absolutely critical, which is why we put together a definitive guide for investors on how to calculate cap rates in real estate. This is the core of disciplined, value-driven investing.

Understanding What a Cap Rate Does Not Tell You


A cap rate is a fantastic starting point—think of it as a quick, back-of-the-napkin sketch of a deal. But relying on it alone is like trying to drive across the country with only a rearview mirror. It shows you exactly where the property stands today, but gives you zero insight into the road ahead.


To make smart, disciplined investment decisions, you have to know what the cap rate is leaving out.


The biggest blind spot? A cap rate is just a snapshot in time. It’s based on a single, 12-month period of a property’s net operating income (NOI). That static view completely misses the one thing you can count on in real estate: change.


The Problem with a Static View


A simple cap rate calculation doesn't account for the forward-looking variables that actually drive long-term value. This is the exact point where a rookie investor stops their analysis, while a seasoned pro knows it’s time to dig deeper.


Here’s what the cap rate conveniently ignores:


  • Future Rent Growth: The formula assumes income will stay flat forever, which simply never happens in a living, breathing market. A great property in a growing neighborhood might have huge potential for rent bumps that the current cap rate doesn't even hint at.

  • Major Capital Expenditures (CapEx): The calculation completely overlooks the future cost of big-ticket items. That new roof, the HVAC system on its last legs, or a parking lot that needs repaving? Those are real costs that will hit your cash flow down the line.

  • The Impact of Debt (Leverage): Cap rates are always calculated on an all-cash basis. They tell you absolutely nothing about how financing will shape your actual returns, which is the heart and soul of most real estate deals.


Moving Beyond the Cap Rate


Because of these gaps, experienced investors treat the cap rate as a starting line, not a finish line. They layer in other, more dynamic metrics to build a complete picture of how an investment will perform over the entire time they plan to own it.


Why It Matters: If you rely only on a cap rate, you could easily overpay for a property with declining income or, just as bad, pass on a diamond-in-the-rough value-add deal with massive upside. It’s a tool for quick comparisons, not a complete valuation model.

Two of the most important metrics to use alongside the cap rate are:


  • Cash-on-Cash Return: This one gets personal. It measures your annual pre-tax cash flow against the actual cash you put into the deal. It answers the most important question: "What return am I really getting on my own money?"

  • Internal Rate of Return (IRR): This is the heavyweight champion of real estate metrics. It’s a more complex calculation that projects your total return over the entire life of the investment, factoring in the time value of money, all future cash flows, and the final sale price.


How We Use Cap Rates in Our Investment Strategy


At Stiltsville Capital, we look at the cap rate as a critical checkpoint in our underwriting process, but never the final verdict on a deal. Think of it as a starting point for asking much deeper questions. It’s a powerful tool for quickly screening properties and comparing them to the market, but its real value comes out when we start digging into what’s behind the number.


We never look at a property's cap rate in isolation. The first thing we do is put it in context by comparing it against current interest rates and what it costs us to borrow. This comparison, what we call the cap rate spread, gives us an immediate feel for whether a deal has the potential for positive leverage.


A Forward-Looking Approach


More importantly, we're obsessed with the trajectory of the cap rate, not just where it sits today. Our analysis really boils down to two key questions:


  • Where is the cap rate today? This gives us a baseline—a snapshot of the property’s value based on current market sentiment and how it’s performing right now.

  • Where do we project the cap rate will be when we sell? This is the big one. It forces us to underwrite what the market might look like in the future, not just what it looks like today.


This forward-looking perspective is the engine behind our value-add and opportunistic strategies. We actively hunt for properties where the "going-in" cap rate is higher than it should be, usually because of simple things like poor management, overdue maintenance, or rents that are way below what the market will bear.


Our business plan is all about systematically fixing these problems. By improving the property and boosting its Net Operating Income (NOI), we directly increase its value and work toward a lower, more attractive "exit cap rate."

Beyond the Numbers


At the end of the day, a cap rate is just one metric. It’s a vital piece of the puzzle, but it doesn't show you the whole picture. While cap rates are a fundamental tool we use, they are just one part of a much broader framework for how to evaluate real estate investment opportunities the right way.


Our real expertise isn't just in running the numbers; it's in executing a business plan that transforms a property from what it is today to what it can be tomorrow. We blend disciplined data analysis with boots-on-the-ground asset management to create value and deliver the risk-adjusted returns our investors count on. The numbers point us in the right direction, but it's our execution that builds lasting wealth.


Your Investor Checklist: 5 Questions to Ask About Cap Rate


When a sponsor presents a deal, the cap rate is often the headline number. Use these questions to look beyond the initial figure and truly understand the story behind it.


  1. Is the Proforma NOI Realistic? * Ask for the trailing 12-month (T12) financials and compare them to the projected NOI. Are the rent growth and expense savings assumptions aggressive or supported by market data?

  2. What's the Local Market Cap Rate? * What are comparable properties in the immediate submarket trading for? A deal that looks cheap at a 6% cap rate might be overpriced if everything else is trading at 7%.

  3. How Was the Vacancy Rate Calculated? * Is the sponsor using the property's actual current vacancy or a generic market rate? Scrutinize this number, as a small change can significantly impact the NOI and valuation.

  4. Are There Major Capital Expenditures Coming Due? * A high cap rate might look tempting, but not if you have to replace a $500,000 roof in year one. Ask for a detailed capital needs assessment.

  5. What is the Assumed Exit Cap Rate? * This is crucial. A sponsor's return projections depend heavily on this assumption. Is their exit cap rate assumption conservative (e.g., higher than the entry cap rate) or aggressive?


Final Thoughts: Cap Rate as a Compass, Not a Map


Understanding cap rates is non-negotiable for anyone serious about real estate investing. It's the language of the market, offering a quick read on risk, return, and value. For family offices and high-net-worth investors, it’s a critical first-pass filter for sorting through opportunities and identifying assets that align with your portfolio goals—whether that's stable income, inflation hedging, or long-term appreciation.


However, disciplined investing demands we go deeper. A cap rate tells you where a property is, but a sophisticated strategy is built on understanding where it's going. By combining this essential metric with forward-looking analysis and a hands-on execution plan, well-structured real estate can be a prudent, resilient component of a long-term wealth strategy.


Take the Next Step


Ready to explore how institutional-quality real estate can fit into your portfolio? Our team is available to discuss your financial goals and our current opportunities.


Schedule a confidential call with Stiltsville Capital.


Information presented is for educational purposes only and does not constitute an offer to sell or a solicitation of an offer to buy securities. Any offering is made only through definitive offering documents (e.g., private placement memorandum, subscription agreement) and is available solely to investors who meet applicable suitability standards, including “Accredited Investor” status under Rule 501 of Regulation D. Investments in private real estate involve risk, including loss of capital, illiquidity, and no guarantee of distributions. Past performance is not indicative of future results. Verification of accredited status is required for participation in Rule 506(c) offerings.


Reading Time: 7 min | Good for Investor Personas: A, B


Figuring out a property's cap rate is a foundational skill for any serious real estate investor. In its simplest form, you just divide the property's Net Operating Income (NOI) by its current market value. This single number gives you the asset's unlevered annual return—a powerful, apples-to-apples tool for quickly sizing up different investment opportunities before committing to a deep dive.


TL;DR: Key Investor Takeaways* What It Is: A cap rate measures a property's unlevered annual return, allowing for direct comparison between different assets.* How to Calculate: The formula is Cap Rate = Net Operating Income (NOI) / Property Market Value.* Why It Matters: It provides a quick snapshot of profitability and market sentiment, separate from financing.* Next Step: Mastering the inputs (NOI and Market Value) is crucial for accurate analysis and disciplined underwriting.

The Core Formula for Cap Rate Calculation


Think of the capitalization rate as the real estate world's version of a stock's dividend yield. It’s a quick snapshot of how profitable a property is, totally separate from any financing. Getting comfortable with key metrics like this is fundamental to real estate investing. If you want to go broader, here's a comprehensive guide to calculating financial ratios that covers more ground.


The formula itself couldn't be easier:


Cap Rate = Net Operating Income (NOI) / Property Market Value

This simple calculation is what lets you benchmark potential deals so efficiently. It allows a multifamily asset in Austin to be compared directly against a distribution warehouse in Phoenix based on its core yield, cutting through the noise of different property types and locations.


Breaking Down the Components


To really get value from the formula, you have to know what goes into it. Each piece of this puzzle tells a part of the property's financial story, and knowing where to find them is half the battle.


Here’s a quick cheat sheet for the moving parts.


Cap Rate Formula Components at a Glance


Component

What It Is

Where to Find It

Net Operating Income (NOI)

The property's total income minus all operating expenses, before mortgage payments or income taxes.

Property's T-12 (trailing 12 months) profit & loss statement; Sponsor's pro forma financials.

Property Market Value

The price the property would likely sell for in the current market.

Recent comparable sales data ("comps"); Broker Opinion of Value (BOV); Professional appraisal.

Capitalization Rate (Cap Rate)

The resulting percentage that represents the unlevered annual return on the asset.

Your own calculation; Market reports from firms like CBRE or JLL.


Once you’ve got these inputs, you’re ready to go.


Mastering this basic calculation is the first real step toward disciplined underwriting. It sets the foundation for a much more granular analysis of any asset's true potential.


Calculating Net Operating Income with Confidence


An accurate cap rate is only as good as the Net Operating Income (NOI) you use to calculate it. This number is everything—it's the property's true, unvarnished profitability before any debt gets factored in. This is where deals are made or broken, and where sloppy analysis can lead investors way off course.


Getting the NOI right is non-negotiable.


You always start with the Gross Potential Income (GPI). Think of this as the absolute maximum revenue the property could pull in with 100% occupancy. It's not just rent; it includes every income stream, from parking fees and laundry machines to storage unit rentals.


From there, you have to be realistic and subtract an allowance for vacancy and credit loss. That gives you the Effective Gross Income (EGI). Then, it's time to deduct all the legitimate operating expenses.


A detailed financial document being analyzed with a magnifying glass, emphasizing scrutiny of income and expenses.


What Counts as an Operating Expense


True operating expenses are the recurring, day-to-day costs needed to keep the property running and the tenants happy. They generally fall into a few buckets:


  • Fixed Expenses: These don't change much, regardless of occupancy. Think property taxes and building insurance.

  • Variable Expenses: These costs fluctuate with occupancy and usage—things like utilities, general maintenance, and repairs.

  • Management Fees: Whether you hire a professional or manage it yourself, you always need to account for a professional management fee. A realistic figure is typically 4-8% of EGI, and including it ensures you can make fair, apples-to-apples comparisons with other properties.


What to Exclude from Your Calculation


This is where discipline comes in. A "clean" NOI is the only way to compare different deals on a level playing field. The following items absolutely must be left out of your calculation:


  • Debt Service: Your mortgage principal and interest are financing costs, not operational ones. They have nothing to do with the building's performance.

  • Capital Expenditures (CapEx): A new roof or an HVAC system replacement isn't a daily operating cost. These are major, one-time investments that improve the property's lifespan and value.

  • Depreciation: This is a non-cash, "paper" deduction for tax purposes. It doesn't impact your actual cash flow.

  • Tenant Improvements & Leasing Commissions (TI/LCs): These are capital costs tied to securing a tenant, not operating the building day-to-day.


Why This Matters (Persona A): When you strip these items out, you isolate the property's raw performance. It stops a highly leveraged building from looking less profitable than an identical, all-cash property next door. This keeps your initial analysis honest and unbiased.

Always scrutinize the financials a seller provides and check them against real market data. For a much deeper dive into the nuts and bolts, check out our guide on how to find Net Operating Income. Mastering this skill is what separates investors who just accept numbers from those who build their own defensible NOI—the bedrock of every great real estate deal.


Establishing Market Value with Comparable Sales


The other half of the cap rate equation—market value—can feel like a moving target, especially when you're looking at off-market deals.


While there are several ways to value a commercial property, analyzing comparable sales (or "comps") is the most reliable, data-backed approach an investor can take. It’s how you ground your numbers in reality.


This process is definitely more art than science. It requires you to look past simple metrics like price-per-square-foot. True comparability comes from a much deeper analysis of assets that genuinely mirror the property you’re targeting. At the end of the day, it’s all about building a defensible argument for a specific valuation.


Sourcing and Selecting True Comps


First, you need solid sales data. This is often found through your broker network or on institutional-grade platforms like CoStar, LoopNet, and CREXi. Once you have a pool of recent sales, the real work begins: narrowing it down to the properties that actually matter.


A strong comparable property should line up on several critical fronts:


  • Property Subtype and Class: You can't compare apples to oranges. A Class A urban high-rise is a world away from a Class B garden-style complex in the suburbs.

  • Location: Stick to the same submarket. Ideally, you want sales within a one- to two-mile radius that share similar demographic trends and access to amenities.

  • Building Size and Age: Look for properties of a similar scale and vintage. A 50-unit building from the 1970s carries a completely different risk profile than a new 250-unit development.

  • Tenant Quality and Lease Terms: Are the tenants national credit names on long-term leases, or are they local businesses with short terms remaining? This makes a huge difference.

  • Physical Condition and Amenities: You have to account for recent renovations, any deferred maintenance, and the quality of shared facilities.


Investor Takeaway: No two properties are ever identical. The goal is to find the closest possible matches and then make intelligent, data-driven adjustments for any real differences you find.

Making Smart Adjustments


Once you've locked in three to five solid comps, it's time to adjust their sale prices to account for those differences. Think of it like this: if a comp has a brand-new roof but your target property needs one, you would adjust the comp's price downward to normalize the comparison.


Likewise, if a comp has a significantly higher occupancy rate, its price needs to be adjusted to reflect that superior performance. This detailed process of sourcing, selecting, and adjusting comps is what transforms a subjective guess into a market-supported valuation.


For a broader overview of this and other valuation techniques, explore our guide on the top commercial real estate valuation methods for investors.


This is how you gain the confidence to calculate a truly meaningful cap rate.


A Step-by-Step Cap Rate Calculation in Action


Theory is great, but let’s underwrite a deal together. Seeing the numbers in motion is the best way to really grasp how to calculate cap rates and, more importantly, what they tell you about a potential investment.


We'll work through a straightforward case study: a 100-unit multifamily property. Our goal is to get from the top-line rent figure all the way down to a defensible cap rate, making realistic assumptions as we go.


Deal Lens: A 100-Unit Apartment Building


First, we need to establish the property's income potential. If each of the 100 units rents for an average of $1,500 per month, our Gross Potential Rent is $1,800,000 annually.


But let's be realistic—no building stays 100% full. We have to account for vacancies and tenants who don't pay. Let's pencil in a 5% vacancy and credit loss factor, which is a common benchmark in the industry. This knocks $90,000 off our income, bringing us to an Effective Gross Income (EGI) of $1,710,000.


Next up are the operating expenses. These are the real, tangible costs of keeping the lights on and the property running smoothly day-to-day.


  • Property Taxes: $250,000

  • Insurance: $75,000

  • Utilities (Common Area): $60,000

  • Repairs & Maintenance: $100,000

  • Property Management (5% of EGI): $85,500

  • General & Administrative: $30,000


Our Total Operating Expenses come out to $600,500. When we subtract this from our EGI, we land on a Net Operating Income (NOI) of $1,109,500.


To get our cap rate, we need one more piece of the puzzle: the property's market value. After analyzing three recent and comparable sales in the submarket, we can confidently value this asset at $20,000,000.


The infographic below shows how a disciplined process for finding and adjusting comps helps you arrive at a valuation grounded in reality, not just guesswork.


Infographic about how to calculate cap rates


Here's a table that breaks down the calculation from top to bottom, making it easy to see how we got to our NOI.


Illustrative Cap Rate Calculation (100-Unit Multifamily Asset)


Line Item

Calculation/Note

Amount

Gross Potential Rent (GPR)

100 units x $1,500/mo x 12 mo

$1,800,000

Vacancy & Credit Loss

5% of GPR

($90,000)

Effective Gross Income (EGI)

GPR - Vacancy

$1,710,000

Property Taxes

-

($250,000)

Insurance

-

($75,000)

Utilities

Common area only

($60,000)

Repairs & Maintenance

-

($100,000)

Property Management

5% of EGI

($85,500)

General & Administrative

-

($30,000)

Total Operating Expenses

Sum of all expenses

($600,500)

Net Operating Income (NOI)

EGI - Total Expenses

$1,109,500

Market Value

Based on comparable sales

$20,000,000

Cap Rate

NOI / Market Value

5.55%


This step-by-step flow is exactly how institutional investors and savvy private buyers underwrite properties every single day.


Putting It All Together


Now that we have both the NOI and the Market Value, the final calculation is straightforward:


Cap Rate = $1,109,500 (NOI) / $20,000,000 (Market Value) = 5.55%

This 5.55% cap rate isn't just a number; it's a powerful benchmark. It gives us a standardized way to compare this deal against other opportunities. For context, historical data from Q1 2001 to Q4 2022 shows that the average cap rate across major U.S. property types hovered around 6.29%, according to CBRE Research. You can dig deeper into these long-term trends and the connections of commercial property cap rates on CBRE.com.


By comparing our 5.55% figure to other properties in the same market, we can start to get a real feel for whether this deal is priced fairly, at a premium, or if it might just be a bargain.


How Market Dynamics Shape Cap Rates


A cap rate isn't just a number you plug into a spreadsheet; it’s a story about what the market is feeling. Getting a handle on the powerful forces that make cap rates rise and fall is what separates simple arithmetic from truly strategic investing. It's how a static number becomes a crystal ball for risk, opportunity, and what a property is really worth.


The most important thing to grasp is the inverse relationship between property values and cap rates. It’s like a seesaw.


When investor demand is high and capital is flooding a market, buyers are willing to pay more for the same amount of income. This pushes property values up and, as a result, drives cap rates down. We call this cap rate compression. On the flip side, when uncertainty creeps in or money gets tight, property values often soften, causing cap rates to rise, or "expand."


The Influence of Interest Rates and Capital Flows


Macroeconomic factors are the invisible hands guiding these trends. The biggest one? The cost of capital, which is often benchmarked against the 10-year Treasury yield. When yields on safe government bonds go up, real estate has to offer a better return to compete for investor dollars. This usually puts upward pressure on cap rates.


But it’s not always a straight line. The spread, or difference, between cap rates and Treasury yields tells you a lot about how much risk investors are willing to take on.


Think back to 2006 and 2007. Even as Treasury yields started climbing, cap rates kept getting squeezed lower and lower. The spread tightened to historic lows right before the Great Recession hit. This was a classic sign of a market with an unsustainable appetite for risk.


Investor Takeaway: Looking at a cap rate in a vacuum is a huge mistake. You always have to ask why it is what it is. Is a low cap rate backed by strong rent growth, or is it just a sign of an overheated market fueled by cheap debt?

Today, we can lean on more than just gut feelings. Advanced tools can help us anticipate where things are headed. For a deeper dive into how to forecast future trends, it's worth exploring predictive analytics in real estate investment. By understanding these external drivers, you can move beyond just running the numbers and start making smarter decisions, no matter what the market is doing.


Common Cap Rate Questions from Investors


Once you get the hang of the basic cap rate calculation, the real-world questions start popping up. It's one thing to know the formula, but it's another to apply it when a deal is on the line.


Let’s break down some of the most common questions we hear from investors as they move from theory to practice.


Is There a Single Good Cap Rate?


This is, without a doubt, the question we hear most often. And the answer is a firm no.


A "good" cap rate is completely relative. It’s shaped by the type of property, its location, the building's condition, and market sentiment. A 4.5% cap rate on a brand-new apartment building in a hot downtown market could be a steal. On the other hand, a 7.5% cap rate on an older, struggling suburban office building might be a major red flag.


Context is everything. Instead of fixating on a single number, you should be comparing your target property’s cap rate to similar properties that have recently sold in the same neighborhood. For a deeper dive on this, our team put together a guide on what is a good cap rate for real estate investors that really unpacks the nuances.


How Do Cap Rates Apply to Value-Add Deals?


Cap rates are most useful for stabilized, income-producing properties. For value-add projects—where you’re actively trying to boost the NOI—investors look at it through two different lenses:


  • Going-In Cap Rate: This is based on the property's current, often underperforming, income. It's usually higher because it reflects the problems you're about to solve.

  • Exit Cap Rate (or Residual Cap Rate): This is a projection. You apply this cap rate to the future, stabilized NOI you expect to hit after you've finished renovations and improved operations. This is the number that really determines your potential profit when you sell.


Investor Takeaway: In a value-add deal, the real money is made in the spread between your going-in and projected exit cap rates. You buy based on today's performance but create wealth by selling based on tomorrow's potential.

Why Aren’t Cap Rates Used for Development?


Simple: a cap rate needs a Net Operating Income to exist. Ground-up development projects have zero income while they're being built, so the metric just doesn't apply for the initial valuation.


Why Is Financing Excluded?


A cap rate is an "unlevered" metric. That’s a fancy way of saying it measures the property's pure profitability without factoring in any debt.


But here's the reality: while your mortgage isn't in the formula, it absolutely impacts the returns you demand. When interest rates go up, investors need higher cap rates to make sure their cash-on-cash return still makes sense. One way to look at this is the 'band-of-investment' technique, which blends the cost of debt and the required return on equity. As of Q1 2024, higher mortgage rates have contributed to cap rate expansion across most property types compared to pre-pandemic levels.


Your Next Step


At Stiltsville Capital, we believe that well-structured real assets can be a prudent, resilient component of a long-term wealth strategy. We help accredited investors navigate these nuances to find opportunities that align with their goals.


If you are ready to explore institutional-grade real estate investments, we invite you to take the next step.


Information presented is for educational purposes only and does not constitute an offer to sell or a solicitation of an offer to buy securities. Any offering is made only through definitive offering documents (e.g., private placement memorandum, subscription agreement) and is available solely to investors who meet applicable suitability standards, including “Accredited Investor” status under Rule 501 of Regulation D. Investments in private real estate involve risk, including loss of capital, illiquidity, and no guarantee of distributions. Past performance is not indicative of future results. Verification of accredited status is required for participation in Rule 506(c) offerings.


Corporate Office

30 West Mashta Drive | Suite 400

Key Biscayne, FL 33149​​

Tel: 786.316.9840

© 2025 Stiltsville Capital LLC

Stiltsville Capital LLC_logo_black

Disclosures

​​​Success Stories and Testimonials are intended to demonstrate our firms professional experience and history of providing exceptional service to their clients and reflect the collective experience of Stiltsville Capital, LLC's Principals and Team members and may include transactions/clients they have worked with directly at previous firms.

Stiltsville Capital, LLC and its affiliates do not provide tax or legal advice. Information contained on this website is provided for educational and illustrative purposes only and cannot be relied upon to avoid tax penalties. Please consult your tax and legal advisors to determine how this information may apply to your own situation. Whether any planned tax result is realized by you depends on the specific facts of your own situation at the time your tax return is filed. 


Real estate and private equity investments have special risks, including possible illiquidity of the underlying properties, credit risk, interest rate fluctuations, and the impact of varied economic conditions and may not be suitable for all investors.

bottom of page