top of page
Search

Reading Time: 8 min | Good for: Novice & Informed Investors (A, B)


TL;DR: What You Need to Know


  • What IRR Is: The Internal Rate of Return (IRR) is the true annualized interest rate an investment is projected to generate over its entire life, accounting for all cash inflows and outflows.

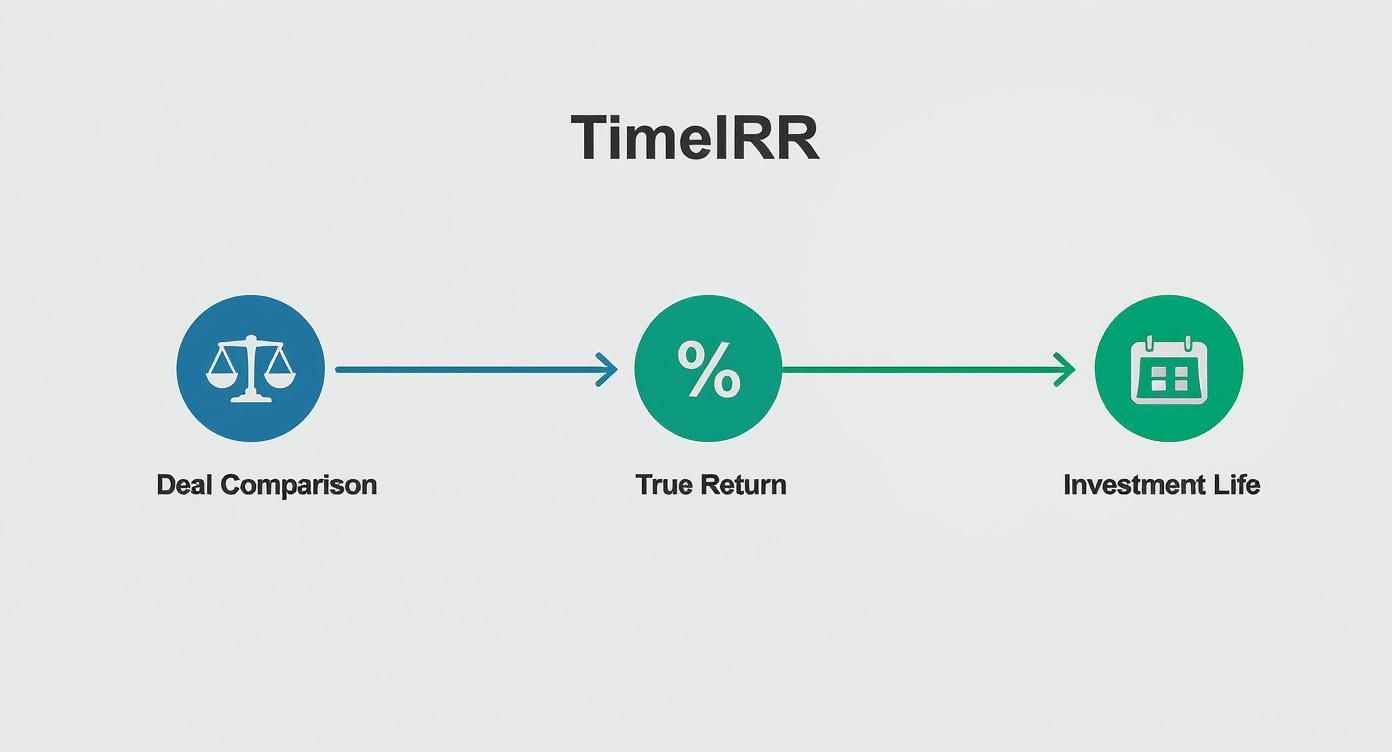
  • Why It Matters: IRR allows investors to compare different real estate deals (e.g., a stable property vs. a development project) on an apples-to-apples basis using a single percentage.

  • How It's Calculated: Using a timeline of cash flows—from initial investment to final sale—IRR is the discount rate that makes the Net Present Value (NPV) of all those cash flows equal zero.

  • What's a "Good" IRR?: It depends on the risk. A low-risk "Core" property might target a 7-10% IRR, while a high-risk "Opportunistic" development could aim for 18%+.

  • Key Limitation: IRR assumes all cash distributions are reinvested at the same high rate, which can be unrealistic. Always use it alongside other metrics like the Equity Multiple.


The internal rate of return, or IRR, is one of the most powerful tools in a real estate investor's toolkit. Put simply, it’s the annualized interest rate an investment is expected to generate over its entire life.


Think of it as the project’s true, all-in growth rate. It’s not just a snapshot; it accounts for every dollar that goes in and every dollar that comes out, which is why it’s a cornerstone for comparing different deals head-to-head. An IRR calculation gives you a single percentage that cuts through the noise and helps you decide if a project clears your personal investment hurdles.


Why IRR Is a Go-To Metric for Real Estate Investors


In the world of private real estate, you'll hear the term IRR thrown around constantly. There's a good reason for that.


Real estate investments aren't simple. They typically start with a huge cash outflow (buying the property), followed by years of smaller, often uneven, cash inflows from rent. And it all wraps up with another big cash inflow when you sell. IRR is one of the few metrics that can take this messy, multi-year timeline and distill it into a single, understandable percentage.


It answers the big question: "What's the real annual return on every dollar I've put into this deal, for the entire time it’s invested?" This is worlds more insightful than basic metrics like ROI, which completely ignore the critical element of time.


Investor Take: A higher IRR is usually a good sign, but it’s not the whole story. You always have to weigh it against the project's risk profile and your own minimum required return, often called a "hurdle rate."

The Power of an Apples-to-Apples Comparison


Let's say you're looking at two totally different opportunities. One is a stable, fully-leased retail center in a great neighborhood. The other is a ground-up apartment development project.


The first offers steady, predictable income right away. The second promises a massive payday, but it’s years down the road. How on earth do you compare them?


This is where IRR shines. It creates a level playing field, giving you a standardized number to judge both deals, no matter how different their timelines or cash flow patterns are.


For those who want to go a bit deeper, IRR is built on the foundation of the discounted cash flow (DCF) model. Understanding how cash flows are valued over time is key to truly grasping an investment's potential and making disciplined decisions with your capital.


To make things even clearer, let's break down the key ideas you need to know.


IRR at a Glance: Key Concepts for Investors


This table boils down the essentials of IRR into plain English, helping you understand not just what it is, but why it's so important for your real estate investment decisions.


Concept

Plain-English Explanation

Why It Matters for Real Estate

Time Value of Money

A dollar today is worth more than a dollar tomorrow. IRR is built on this core principle.

Real estate deals span years. IRR properly values future rental income and sale proceeds in today's dollars.

Cash Flow, Not Profit

IRR focuses on actual cash moving in and out of the project, not just accounting profits.

This gives you a true picture of an investment's liquidity and performance, ignoring non-cash items like depreciation.

The "Hurdle Rate"

This is your personal minimum acceptable return. If the IRR is below your hurdle rate, you pass.

It helps you filter deals quickly and ensures you're only spending time on opportunities that meet your goals.

Single Percentage

IRR boils down a complex series of cash flows over many years into one simple, comparable rate.

It allows you to quickly compare a high-risk development project against a stable, income-producing property.


Ultimately, while IRR is a fantastic metric for comparison, it's just one piece of the puzzle. It tells you about the rate of return, but not the scale of the return. Always use it alongside other metrics to get a complete view before making any investment decision.


Calculating IRR with a Real Estate Example


Theory is great, but let's be honest—nothing makes a concept like IRR click quite like seeing it in action. So, we're going to walk through a real-world calculation for a hypothetical value-add apartment building.


This is where abstract financial models become a tangible story about an investment. By mapping out every dollar in and every dollar out over the life of the deal, we can nail down the exact annualized return.


Deal Lens Example: A Value-Add Multifamily Project


Imagine Stiltsville Capital is looking at a 50-unit apartment building called "The Sunbelt Lofts." The game plan is simple: buy it, give it a strategic facelift during the first year, bring the rents up to where they should be, and sell it after five years.


To calculate IRR, you first need a timeline of all your cash flows. This is the backbone of the whole analysis, and it has to account for every dollar invested and every dollar returned.


Here’s a simplified look at the projected numbers:


  • Year 0 (Initial Investment): -$1,000,000. This is the cash investors put in for the down payment and renovation budget. It's a negative number because it's cash out of your pocket.

  • Year 1: -$50,000. Renovations are in full swing, and the property isn't quite stabilized yet, leading to a small operating loss.

  • Year 2: +$80,000. The upgrades are done, new tenants are moving in at higher rents, and the property is finally generating positive cash flow.

  • Year 3: +$95,000. Rents continue to climb as the building settles into its new, improved status.

  • Year 4: +$110,000. The property is humming along with strong performance and market rent growth.

  • Year 5 (Sale): +$1,600,000. This is the big one. The property is sold, and this final number includes that year's net operating income plus all the net proceeds from the sale.


Infographic about internal rate of return with example


This timeline really shows that IRR isn't just a number; it's a metric that tells the story of the entire investment journey, from the day you buy to the day you sell.


Finding the Magic Number: The IRR Calculation


So, what exactly is IRR?


Internal Rate of Return (IRR) is the specific discount rate that makes the Net Present Value (NPV) of all those cash flows—both negative and positive—equal to zero.

Put more simply, it's the interest rate where the value of all your future earnings perfectly balances out your initial investment. For a deeper dive into how these concepts connect, check out our guide on how to calculate a discounted cash flow for real estate success.


Now, you could calculate this by hand, but it would involve a painful amount of trial and error. Thankfully, we don't live in the dark ages.


Today, any investor can use software like Microsoft Excel or Google Sheets. The formula is beautifully simple: just type and select your range of cash flows, from Year 0 to Year 5.


When we plug in our numbers from The Sunbelt Lofts deal , the formula gives us an IRR of 15.2%.


This 15.2% represents the projected annualized rate of return on every single dollar invested over that five-year hold.


For complex projects, accurately forecasting these cash flows—especially that final sale price—is everything. This is why getting professional property valuation services is so critical. It ensures your exit value, which is a massive driver of your IRR, is grounded in solid market data, not just wishful thinking. It's what separates institutional-grade analysis from a speculative bet.


Interpreting Your IRR: What Is a Good Return?


Getting to an IRR number is one thing. Knowing what to do with it is where the real skill comes in. It’s the single most common question we get: "So, what's a good IRR?"


The honest answer? It depends.


There's no magic number that works for every deal. A good return is always measured against the risk you took to get it and your own personal investment goals. This is why the concept of a hurdle rate is so crucial.


A hurdle rate is your personal line in the sand—the absolute minimum return you're willing to accept for a given investment. Think of it as your financial high-jump bar. If a project’s projected IRR can't clear that bar, you walk away, no matter how great the story sounds.


Setting Your Hurdle Rate


So how do you set that bar? A great starting point is your opportunity cost. What could your money be earning somewhere else with a similar level of risk? Many investors benchmark this against long-term returns of the public stock market, then add a little extra to compensate for the fact that private real estate isn't as liquid.


Novice Lens: A simple way to start thinking about your hurdle rate is to ask, "What is the minimum annualized return I need to make this long-term, illiquid real estate investment worthwhile compared to just buying an S&P 500 index fund?"

This framework keeps you disciplined. An 8% IRR might be a fantastic return for a safe, stabilized office building with a long-term tenant. But for a risky ground-up development project? That same 8% would be a complete non-starter. You need to be paid for taking on more uncertainty.


IRR Varies by Strategy


The target IRR for a real estate deal is a direct reflection of its game plan. Lower-risk strategies, like buying a fully-leased apartment building, naturally have lower return targets. On the flip side, higher-risk strategies that involve heavy lifting—like redeveloping an old warehouse—demand much higher potential IRRs.


Historically, private real estate fund returns have danced with market conditions. Data from INREV’s Global IRR Quarterly Index shows that for the last two decades, most non-listed institutional funds have landed somewhere between 8% and 15% annually. You can discover more insights about global IRR benchmarks from INREV.


Typical IRR Targets by Real Estate Strategy


To give you a clearer picture of what to expect, here’s a quick breakdown of how target IRRs line up with common real estate strategies.


Strategy

Risk Profile

Illustrative Target IRR Range (%)

Core

Low

7% - 10%

Core-Plus

Low to Moderate

9% - 12%

Value-Add

Moderate to High

12% - 18%

Opportunistic

High

18%+


Seeing these benchmarks helps you gut-check a deal sponsor's projections. If they’re pitching a low-risk Core deal with an opportunistic-level IRR, it’s time to ask some tough questions.


Remember, IRR is a powerful tool for comparing apples to apples, but it's just one tool. For a complete view of a deal's potential, you should look at it alongside other key metrics. If you want to dive deeper, check out our guide on the meaning of cash-on-cash return for real estate investors.


The Limitations of IRR and When to Use Other Metrics


A magnifying glass examining a financial chart, symbolizing the need to look closely at investment metrics.


While the internal rate of return is a powerhouse tool for sizing up real estate deals, savvy investors know it’s not a silver bullet. Relying on IRR alone is like driving with only a speedometer—it tells you how fast you’re going, but not where you're headed or if you have enough gas to get there. To build a truly resilient portfolio, you have to understand its blind spots.


One of the biggest debates around IRR is its built-in reinvestment assumption. The formula automatically assumes that every dollar of positive cash flow you receive is immediately put back to work, earning a return identical to the project's final IRR.


Think about that. For a high-octane opportunistic deal with a projected 18% IRR, the math presumes every distribution gets reinvested at that same 18%. That’s a tall order. Finding your next home-run deal is hard enough, let alone a whole series of them back-to-back.


When IRR Can Be Misleading


The metric can also get a bit quirky in certain scenarios, giving you results that need a second look.


  • Multiple IRRs: Sometimes, a deal with unusual cash flows—like a big, unexpected capital expense midway through the hold period—can spit out more than one IRR. This creates ambiguity and makes it hard to know which number to trust.

  • Ignores Scale: IRR is a rate of return, not a measure of wealth created. A small-fry project could boast a 30% IRR and net you $100,000. Meanwhile, a huge institutional deal might deliver a "lower" 15% IRR but generate a massive $10 million in profit. On its own, IRR doesn't tell you the whole story about the dollars in your pocket.


Introducing Complementary Metrics for a Clearer Picture


To get around these weak spots, seasoned investors never rely on a single gauge. They use a full dashboard of metrics. Two of the most powerful partners for IRR are the Equity Multiple and the Modified Internal Rate of Return (MIRR).


Investor Take: Never fall in love with a high IRR in isolation. Always ask, "What is the Equity Multiple?" and "What assumptions are driving this return?" This discipline separates prudent investors from speculators.

The Equity Multiple cuts straight to the chase. It answers one simple question: "How many times will I get my money back?" It’s a clean, powerful way to measure the total cash returned against the total cash invested. For a complete breakdown, you can learn more about the equity multiple formula for real estate in our guide.


Then there's the Modified Internal Rate of Return (MIRR). This metric tackles the reinvestment problem head-on. It lets you plug in a much more realistic rate for reinvesting cash flows—say, a conservative 5% or 6%. This gives you a more sober and achievable forecast.


Using IRR, MIRR, and Equity Multiple together gives you a panoramic view of a deal's potential, balancing speed, scale, and safety.


Comparing Real Estate IRR to Stock Market Returns


Graph comparing a volatile public market line with a smoother private real estate return line over time.


Alright, you see a real estate deal promising a 15% internal rate of return. The first thing you probably wonder is, "How does that stack up against just parking my money in an S&P 500 index fund?" It’s a great question—and the most fundamental one for any investor weighing their options.


But here’s the thing: a direct, apples-to-apples comparison can be tricky. It's like comparing a speed boat to a freight ship. They both travel on water, but they’re built for entirely different purposes.


Private real estate is fundamentally different from public stocks. The biggest difference? Liquidity. You can sell shares of a stock in seconds with a few clicks. Selling a commercial building, on the other hand, is a process that takes months.


For tying up your capital in a long-term, illiquid asset, you should demand a higher return. That extra compensation has a name: the illiquidity premium.


The Illiquidity Premium in Context


Think of the illiquidity premium as the reward you get for your patience. It's the extra juice you earn for locking up your money and committing to a long-term strategy. To understand if that premium is worthwhile, it helps to have a baseline. The stock market is a pretty good one.


Looking back, the U.S. stock market has historically delivered real (after-inflation) returns of about 6% to 7% annually. That’s a solid, long-term benchmark for a liquid investment. If you want to dive deeper, the National Bureau of Economic Research has some great data on century-long global stock market performance.


It’s More Than Just a Headline Number


So when a real estate sponsor targets a 15% IRR, they aren't just trying to beat the stock market's 7%. That headline number is a package deal that accounts for a few other key advantages that real estate brings to the table:


  • Leverage: This is a big one. Real estate allows you to use debt to amplify your returns on equity. It’s a powerful tool that just isn't available to the average stock investor in the same way.

  • Tax Advantages: Real estate comes with unique perks like depreciation, which can significantly boost your after-tax returns. These tax benefits are a major part of the overall value proposition.

  • A Different Kind of Risk: The risks in private real estate are tied to the specific property and market, not the daily mood swings of the public markets. You're dealing with execution risk, not a CEO's bad tweet tanking your stock.


Investor Take: A target real estate IRR is more than just a return percentage. It’s a reflection of the potential reward after factoring in illiquidity, the benefits of leverage, tax advantages, and the unique risks of the asset. Your job as an investor is to decide if that all-in package—and the premium it offers—is the right fit for your portfolio.

Investor Checklist: 5 Questions to Ask About IRR


When a sponsor presents an IRR projection, your due diligence is just beginning. Here are five practical questions to ask to look behind the numbers and truly understand the deal.


  1. What are the key assumptions driving the IRR? Focus on rent growth, exit capitalization (cap) rate, and the projected sale date. Small changes here can dramatically swing the IRR. Are these assumptions conservative or aggressive compared to the market?

  2. How sensitive is the IRR to a later sale date or a higher exit cap rate? Ask for a sensitivity analysis. A resilient deal will still perform reasonably well even if the exit isn't perfect. If the IRR plummets with a small delay, the project has little room for error.

  3. What is the projected Equity Multiple alongside the IRR? This tells you the total cash profit potential. A high IRR on a short hold might look great, but if the equity multiple is low (e.g., 1.3x), you haven't made a lot of money in absolute terms.

  4. How is the sponsor's compensation (promote) tied to the IRR? Understand the waterfall structure. Does the sponsor get paid only after investors receive their capital back plus a preferred return? This aligns interests and rewards performance.

  5. What is the "reversion" value as a percentage of total return? "Reversion" is the cash from the final sale. If a huge portion of the return comes from a speculative sale price five years out, the deal is riskier than one with strong, steady cash flow from day one.


At Stiltsville Capital, we believe a deep understanding of metrics like IRR is the foundation of disciplined real estate investing. If you're an accredited investor looking to apply this knowledge to institutional-quality deals in growing markets, we invite you to schedule a confidential call to discuss your investment objectives and how well-structured real estate can be a prudent, resilient component of your long-term wealth strategy.


Information presented is for educational purposes only and does not constitute an offer to sell or a solicitation of an offer to buy securities. Any offering is made only through definitive offering documents (e.g., private placement memorandum, subscription agreement) and is available solely to investors who meet applicable suitability standards, including “Accredited Investor” status under Rule 501 of Regulation D. Investments in private real estate involve risk, including loss of capital, illiquidity, and no guarantee of distributions. Past performance is not indicative of future results. Verification of accredited status is required for participation in Rule 506(c) offerings.


Reading Time: 8 min | Good for: Novice (A), Informed (B), Sophisticated (C)


In commercial real estate investing, two metrics form the bedrock of every sound decision: Net Operating Income (NOI) and the capitalization rate, or cap rate. Think of them as the vital signs of an investment property. They cut through market noise to reveal a property's true earning power and its value relative to other opportunities.


Simply put, NOI is a property's pure annual profit before factoring in debt service or capital improvements. The cap rate expresses that profit as an unlevered rate of return, providing a standardized yardstick for comparison.


TL;DR: Key Takeaways


  • NOI is Pure Profit: It measures a property's operational profitability, calculated as all revenue minus necessary operating expenses.

  • Cap Rate is Relative Value: The cap rate (NOI / Property Value) shows your potential unlevered return and allows for apples-to-apples comparisons across different assets and markets.

  • Inverse Relationship: Property values and cap rates move in opposite directions. When values rise, cap rates compress (fall), and vice versa.

  • Forced Appreciation: The most powerful value-add strategies focus on increasing a property's NOI, which directly increases its market value at a given exit cap rate.


Market Why-Now: The Rate Environment Matters


The relationship between interest rates and real estate values is more critical than ever. After a period of historically low rates, the U.S. 10-Year Treasury yield—a key benchmark for real estate risk premiums—has seen significant volatility, hovering above 4.0% for much of 2023-2024. As of Q2 2024, data from CBRE shows that this higher cost of capital has pushed cap rates upward across most property types. This market shift underscores the importance of disciplined underwriting and focusing on assets with strong NOI growth potential to offset valuation headwinds.


This guide is designed for investors at every level—from those just building a portfolio to sophisticated family offices that need to benchmark risk with institutional precision. We'll walk through exactly how these metrics work, from the basic math to strategic market analysis.


How to Calculate Net Operating Income (NOI) Step by Step


Before you can underwrite a commercial real estate deal, you must arrive at its financial core: the Net Operating Income (NOI). This calculation is foundational because it strips away financing and capital expenditures to reveal a property’s raw, unlevered profitability.


Think of NOI as the horsepower of a property's economic engine. Before discussing speed or efficiency (where the cap rate comes in), you must first know how powerful that engine is.


This chart lays out the journey from a property's gross potential to its net operating income, a clear picture of its profit and potential.


Infographic about net operating income cap rate


As you can see, nailing down a property's income and expenses is the essential groundwork for figuring out what kind of return you can expect.


Step 1: Start With Gross Potential Income (GPI)


First, establish the Gross Potential Income (GPI). This is the absolute maximum income a property could generate if every unit were occupied for the entire year, with every tenant paying full market rent without a single delay. It's the "perfect world" number.


For a 50-unit apartment building where each unit commands $2,000 per month:


  • 50 units x $2,000/month x 12 months = $1,200,000


Step 2: Adjust For Vacancy And Credit Loss


Now, let's return to reality. No property is 100% occupied all the time, and unfortunately, not every tenant pays on time. To find the Effective Gross Income (EGI), you must subtract an allowance for these vacancies and credit losses. This rate is usually based on the property’s history and local market data.


Using a conservative 7% vacancy and credit loss rate:


  • Vacancy Loss: $1,200,000 (GPI) x 7% = $84,000

  • EGI: $1,200,000 - $84,000 = $1,116,000


This EGI figure is what you can realistically expect to collect.


Step 3: Subtract Operating Expenses (OpEx)


From your realistic income, it's time to subtract the Operating Expenses (OpEx). These are all the day-to-day costs that keep the lights on and the property running smoothly. Getting this right means tracking everything meticulously, which is where good property management apps become invaluable.


Common operating expenses include:


  • Property Taxes: The non-negotiable bill from the local municipality.

  • Property Insurance: Essential coverage for liability, fire, and other potential disasters.

  • Utilities: Costs for common areas not directly billed to tenants.

  • Repairs & Maintenance: Ongoing costs for plumbing, landscaping, HVAC, and general upkeep.

  • Property Management Fees: Typically a percentage of EGI, often between 4-8% for multifamily properties.


### Novice Lens: What NOT to Include in OpExIt’s absolutely critical to exclude these items from your OpEx calculation. Forgetting this is a common mistake.* Debt Service: Your mortgage payments (principal and interest).* Capital Expenditures (CapEx): Major, infrequent costs like a new roof or HVAC system.* Depreciation: An accounting concept, not a cash expense.NOI measures the property's performance independent of your financing or long-term capital strategy.

For our example building, let's say the total annual OpEx adds up to $450,000.


Illustrative NOI Calculation for a Multifamily Property


Here’s a simple table that walks through the entire calculation, from top-line potential to the bottom-line NOI.


Line Item

Calculation/Notes

Amount

Gross Potential Income (GPI)

50 units @ $2,000/mo for 12 months

$1,200,000

Less: Vacancy & Credit Loss

7% of GPI

($84,000)

Effective Gross Income (EGI)

GPI - Vacancy & Credit Loss

$1,116,000

Less: Operating Expenses (OpEx)

Sum of all day-to-day costs

($450,000)

Net Operating Income (NOI)

EGI - Total OpEx

$666,000


This final number—the Net Operating Income—is the pure, unlevered profit generated by the property itself.


Step 4: The Final NOI Calculation


With all the pieces in place, the final step is simple subtraction:


  • NOI = EGI - Total Operating Expenses

  • NOI = $1,116,000 - $450,000 = $666,000


This $666,000 figure is the key. It's the number that tells you exactly how much cash the asset produces before any debt is paid, and it's the number you’ll use to calculate the net operating income cap rate.


Understanding the Capitalization Rate Formula


Once you’ve nailed down the Net Operating Income, you have the raw financial horsepower of the asset. The next step is translating that power into a measure of investment yield and market value. That’s where the capitalization rate, or cap rate, comes in.


It's one of the most-cited metrics in commercial real estate for a good reason.


A graph showing the inverse relationship between property values and cap rates


At its heart, the formula is refreshingly simple, creating a direct link between a property's income, its value, and its potential return.


The Core Formula


You calculate the cap rate by dividing a property's Net Operating Income by its current market value or purchase price.


  • Cap Rate = Net Operating Income (NOI) / Property Value


Think of the cap rate as the unlevered annual return on your investment. In other words, if you bought a property with all cash, the cap rate would be your cash-on-cash return for the first year, before factoring in taxes or appreciation. It gives investors a standardized way to compare the relative value of different opportunities.


For example, a property with an NOI of $100,000 valued at $2,000,000 has a cap rate of 5.0% ($100,000 ÷ $2,000,000).


The Inverse Relationship Between Value and Cap Rates


This is a critical concept. There's an inverse relationship between property values and cap rates. When one goes up, the other goes down.


  • Higher Property Values lead to Lower Cap Rates (cap rate "compression"). This typically happens when demand is high and investors are willing to pay more for the same income stream, accepting a lower initial yield to get into a hot market.

  • Lower Property Values lead to Higher Cap Rates (cap rate "expansion"). This occurs when perceived risk increases or demand cools, forcing sellers to lower prices to attract buyers seeking higher returns.


### Insight Edge: What's a "Good" Cap Rate?A "good" cap rate is entirely dependent on your investment strategy. A growth-focused investor might eagerly accept a low 4.5% cap rate for a Class A apartment building in a booming Sunbelt city, betting on future rent growth and appreciation. In contrast, an income-focused investor may target a higher 6.5% cap rate on a stabilized asset in a secondary market for more immediate cash flow, accepting lower growth potential. Your goals define the metric's value.

How Market Dynamics Influence Cap Rates


A cap rate isn't just a static formula; it’s a living reflection of the broader economy and investor sentiment. Understanding the forces that push cap rates up or down is crucial for accurate underwriting, smart forecasting, and knowing when to enter—or exit—an investment.


Interest Rates and the 10-Year Treasury


The biggest outside influence on cap rates is the cost of capital. The key benchmark is the 10-year Treasury yield, often considered the "risk-free" rate of return. Commercial real estate is inherently risky—it's illiquid and requires active management—so it must offer a return significantly higher than the 10-year Treasury. This gap is known as the risk premium or "spread."


When interest rates rise, borrowing becomes more expensive. To hit their target returns, investors need higher yields from properties, which puts direct upward pressure on cap rates. While cap rates and the 10-year Treasury historically move in tandem, they don't always sync perfectly. A full analysis of these cycles shows how these relationships play out over time.


The Impact of Location and Property Type


Just like in residential real estate, location is everything. A new, Class A apartment building in a booming primary market will trade at a much lower cap rate than an older, Class B office building in a city with declining job growth. This difference comes down to perceived risk and future growth potential.


  • Primary Markets (e.g., Miami, Austin): These hotspots command lower cap rates (compression) because of strong population growth, high liquidity, and potential for rent increases. Investors will pay a premium for that stability and upside.

  • Secondary/Tertiary Markets: You'll find higher cap rates here. Investors need to be compensated for taking on more perceived risk, dealing with fewer potential buyers, and facing more uncertain growth prospects.

  • Asset Class: The property type matters. A stabilized multifamily complex with diversified tenant risk is considered safer than a retail building relying on a single tenant. The riskier asset will demand a higher cap rate.


Investor Takeaway: Looking at today's cap rate is only half the battle. You must forecast where it's headed. If you buy a property at a 5% cap rate but expect rising interest rates to push market cap rates to 6% by your planned exit, your property's NOI must grow enough to overcome that headwind and protect your investment's value. This is a core principle of our disciplined approach at stiltsvillecapital.com.

Putting NOI and Cap Rate to Work in Your Analysis


A professional analyzing real estate investment charts and data on multiple screens.


Now that you have a solid grip on NOI and cap rates, it’s time to move from theory to action. These two metrics are the workhorses of underwriting, letting you quickly size up deals, compare opportunities, and pinpoint where true value lies.


Using Market Cap Rates to Estimate Property Value


One of the most powerful uses of the net operating income cap rate is for a quick, "back-of-the-envelope" valuation. If you know the going cap rate for a certain property type in a specific market, you can estimate its value in minutes. The formula is a simple rearrangement:


  • Property Value = Net Operating Income (NOI) / Market Cap Rate


Let's say a multifamily building generates an NOI of $500,000. You know from market data that similar properties recently sold at a 5.0% cap rate. Your initial valuation would be $10 million ($500,000 / 0.05).


This calculation is a critical first step in our due diligence, helping us filter out overpriced deals before committing significant resources. Our team uses this daily to see if an opportunity aligns with our strict acquisitions criteria.


The Deal Lens Example: Creating Equity with a Value-Add Strategy


Here’s where savvy investors build wealth. A value-add strategy is about actively increasing a property's NOI, which directly pushes up its value for a profitable exit.


  1. The Acquisition: You buy an underperforming apartment building for $10 million. Its current NOI is $500,000, meaning you acquired it at a 5.0% "going-in" cap rate.

  2. The Value-Add Plan: You invest $1 million in capital improvements—modern kitchens, updated bathrooms, and refreshed common areas—to justify higher rents.

  3. The Resulting NOI: After the renovation, the property’s NOI jumps to $650,000, thanks to increased rental income and more efficient operations.

  4. The Exit: The property is now stabilized and renovated. The market for these premium assets is stronger, and they're trading at a lower 4.75% "exit" cap rate. Your property is now valued at approximately $13.68 million ($650,000 / 0.0475).


### Key Takeaway: Forced AppreciationBy increasing the NOI from $500,000 to $650,000, you didn't just add $150,000 in annual income—you "forced" the property's value to appreciate by over $3.6 million. This is the heart of a successful value-add real estate strategy. Utilizing sophisticated tools like Real Estate Business Intelligence can provide a major edge in identifying these opportunities.

Your Investor Checklist: 7 Questions to Ask a Sponsor


When evaluating a deal, use these questions to dig beyond the surface-level numbers:


  1. NOI Verification: Is the presented NOI based on trailing 12-month actuals (T12) or a forward-looking pro forma? Can you provide detailed, itemized financials?

  2. CapEx Reserves: What are the planned capital expenditures over the next five years, and how are they being funded? Are these costs realistically budgeted?

  3. Vacancy Assumptions: How does your vacancy assumption compare to the submarket's historical average for this asset class?

  4. Rent Growth Projections: What specific market data supports your rent growth assumptions? Are they in line with forecasts from third-party sources like CoStar or CBRE?

  5. Operating Expense Comparables: How do the property's operating expenses per unit compare to similar assets in the area? Are there clear opportunities for efficiency gains?

  6. Exit Cap Rate Sensitivity: How does the projected return change if the exit cap rate is 50 or 100 basis points higher than your base case?

  7. Management Track Record: What is your track record of achieving projected NOI growth on similar properties in this market?


FAQ: Digging Deeper on NOI & Cap Rates


Once you get the hang of NOI and cap rates, a few common questions always pop up. Let's tackle them head-on.


What’s a “Good” Cap Rate in today's market?


This is the million-dollar question, and the answer remains: it depends entirely on your goals, the property type, and the market. A low cap rate (e.g., 4.5%) in a high-growth market like Austin might be a home run for a growth-focused investor. In contrast, an income-focused investor might target a 6.5% cap rate in a stable secondary market for steady cash flow. A "good" cap rate is one that fits your risk appetite and adequately compensates you for the asset's location and quality.


Does a Bigger NOI Automatically Mean a Better Deal?


Not by itself. A massive NOI is great, but the real question is, what did you have to pay to get it? That’s what the cap rate tells you. A property generating a $1 million NOI is fantastic, but if it costs $25 million (a 4% cap rate), it may be less attractive than an asset with a $750,000 NOI acquired for $10 million (a 7.5% cap rate). The relationship between income and cost defines your return.


How Do Interest Rates Play into All This?


When the Fed raises rates, borrowing becomes more expensive. To compensate, real estate investors demand higher returns (cap rates), which can push property values down. We saw this in the multifamily sector: after hitting historic lows around 4.5% from 2020-2022, aggressive rate hikes pushed average multifamily cap rates up significantly. By 2024, they were hovering around 5.75%—the highest in a decade, according to industry sources. For more on this, see analysis on multifamily cap rate trends.


Investor Takeaway: Pro Forma vs. Trailing NOIWhen looking at a deal, you'll see two types of NOI. The Trailing NOI is based on what the property actually did over the last 12 months. The Pro Forma NOI is a seller's projection of what it could do. A smart investor always starts with the proven, trailing numbers and treats the pro forma with healthy skepticism.

Can a Cap Rate Be Negative?


Theoretically, yes, but it's incredibly rare and a massive red flag. A negative cap rate means operating expenses exceed income—you'd be losing money before paying the mortgage. This only occurs with severely distressed assets. For almost every investor, a negative cap rate is a clear signal to walk away.


At Stiltsville Capital, our disciplined underwriting process is built on a deep, nuanced understanding of these metrics. We analyze every deal through the lens of market dynamics, risk, and value-add potential, believing that well-structured real estate can be a prudent, resilient component of a long-term wealth strategy.


Information presented is for educational purposes only and does not constitute an offer to sell or a solicitation of an offer to buy securities. Any offering is made only through definitive offering documents (e.g., private placement memorandum, subscription agreement) and is available solely to investors who meet applicable suitability standards, including “Accredited Investor” status under Rule 501 of Regulation D. Investments in private real estate involve risk, including loss of capital, illiquidity, and no guarantee of distributions. Past performance is not indicative of future results.


Reading Time 12 min | Good for: Novice (A), Informed (B), Sophisticated (C) Investors


TL;DR: Your Executive Summary


  • Market Selection is Key: This guide moves beyond generic advice to analyze ten distinct market types, from high-growth tech hubs to recession-resilient medical facilities, providing a framework for strategic capital allocation.

  • Execution Matters More: Identifying a promising market is only the first step. Success hinges on partnering with an experienced sponsor who can execute a disciplined, data-driven business plan at the asset level.

  • Actionable Framework: For each market type, we provide a clear investment thesis, key performance indicators to monitor, and practical due diligence questions to ask any potential sponsor.

  • Investor Goal: Our goal is to equip you—whether a family office principal or a sophisticated individual investor—with a durable framework for identifying and capturing value in today's most promising real estate markets.

  • Next Step: Ready to discuss how these strategies fit your portfolio? Schedule a confidential call with Stiltsville Capital.


For sophisticated investors and family offices, identifying the best markets for real estate investment is a perpetual challenge of balancing growth with stability. In a landscape shaped by shifting demographics, technological disruption, and evolving economic currents, the most resilient opportunities are often found where durable demand meets disciplined underwriting. Generic advice falls short; true alpha is generated through a nuanced understanding of specific market drivers, from local job growth engines to regulatory tailwinds.


This analysis cuts through the noise to spotlight ten distinct market types, providing a strategic framework for allocating capital across various property sectors and risk profiles. We'll explore everything from high-growth tech hubs to recession-resistant medical facilities, offering data-driven insights to help you build a robust, institutional-quality real estate portfolio. For investors engaged in active property renovation and resale, learning about tools like virtual notarization for house flippers can also significantly accelerate transaction times and improve operational efficiency.


This guide is designed to serve as a practical roadmap, whether you're a family office principal just beginning to explore passive real estate or a seasoned CIO refining your allocation strategy for the years ahead. Each section provides a clear rationale, key performance indicators to monitor, and actionable insights to inform your diligence process. Our goal is to equip you with a durable framework for identifying and capturing value in the most promising real estate markets of 2025 and beyond.


1. Emerging Tech Hub Markets


For investors seeking high-growth potential outside of saturated primary markets, emerging tech hubs represent one of the best markets for real estate investment today. These secondary and tertiary cities are experiencing rapid economic expansion driven by corporate relocations, startup ecosystems, and an influx of skilled professionals. Unlike established centers like Silicon Valley, these markets often feature lower entry costs for assets, providing a longer runway for significant appreciation in both rental income and property values.


The core dynamic is straightforward: high-paying tech jobs attract a young, educated workforce that needs places to live, work, and spend. This fuels demand across multiple property types, from multifamily and single-family rentals to Class A office space and experiential retail. The "work-from-anywhere" trend has further accelerated this migration, with cities like Austin, Raleigh, and Boise becoming magnets for talent seeking a better quality of life without sacrificing career opportunities.


Investor Checklist: Questions to Ask a Sponsor


To capitalize on this trend, investors should move beyond headline news and analyze leading indicators of sustained growth.


  • Follow the Capital: Monitor venture capital (VC) funding trends using platforms like PitchBook or Crunchbase. A consistent increase in early-stage funding in a specific metro indicates a burgeoning startup scene that will require talent and real estate.

  • Track Corporate Moves: Pay close attention to announcements of new corporate headquarters or major office expansions from established tech giants. These moves, like Oracle's relocation to Austin, act as powerful economic anchors, creating a ripple effect of job creation and demand.

  • Analyze Demographics: Use U.S. Census Bureau data to identify cities with strong net migration, particularly among the 25-40 age demographic. This cohort is in its prime renting and home-buying years.

  • Evaluate Local Support: Investigate municipal and state-level incentives designed to attract tech companies. Tax breaks and infrastructure investments signal a pro-growth environment that can sustain long-term real estate performance. This approach allows investors to position their capital ahead of mainstream recognition, capturing the most significant upside.


2. Gentrifying Urban Neighborhoods


For investors targeting significant capital appreciation, gentrifying urban neighborhoods offer one of the best markets for real estate investment. These transitional areas are characterized by a revitalization cycle where new development, infrastructure upgrades, and demographic shifts create a powerful value-creation flywheel. The process involves an influx of young professionals, artists, and businesses drawn by lower rents and authentic urban character, which in turn attracts further investment and improves amenities. This strategic approach allows investors to acquire assets at a lower basis before the area achieves mainstream appeal and pricing reflects its full potential.


ree


The fundamental driver is the pursuit of an urban lifestyle at a more accessible price point. As primary urban cores become prohibitively expensive, demand spills over into adjacent, underutilized neighborhoods. This migration fuels demand for renovated multifamily housing, creative office spaces, and experiential retail and dining. Landmark transformations in areas like Williamsburg in Brooklyn or Miami's Wynwood Arts District showcase how formerly overlooked industrial zones can become premier cultural and residential destinations. This dynamic presents an opportunity to capture value created through thoughtful urban infill and redevelopment. Learn more about the potential of urban infill strategies and how they drive neighborhood change.


Investor Checklist: Questions to Ask a Sponsor


Success in gentrifying markets requires a granular, street-level due diligence process to identify the early, tangible signs of positive transformation.


  • Identify Anchor Institutions: Pinpoint the presence of major employers that are unlikely to relocate, such as universities, hospitals, or major cultural venues. These "anchors" provide long-term stability and a consistent source of residential and commercial demand.

  • Track Public and Private Investment: Monitor municipal capital improvement plans for projects like new transit lines, parks, or streetscape enhancements. Simultaneously, track building permits for new private developments, which often signal confidence from sophisticated developers.

  • Analyze Commercial Tenant Mix: Observe the arrival of "third wave" businesses like craft coffee shops, independent boutiques, and acclaimed restaurants. The shift from necessity-based retail to lifestyle-oriented tenants is a classic leading indicator of rising disposable incomes.

  • Engage with Community Groups: Connect with neighborhood development associations and business improvement districts. These groups offer invaluable on-the-ground intelligence regarding local sentiment, planned projects, and potential zoning changes that could impact asset values. By combining quantitative data with qualitative insights, investors can more accurately time their entry into these high-upside submarkets.


3. Suburban Growth Corridors


For investors seeking a balanced risk-return profile, suburban growth corridors have emerged as one of the best markets for real estate investment. These areas, often located on the periphery of major metropolitan hubs, are capturing significant population shifts away from dense urban centers. This migration is fueled by a confluence of factors including the rise of remote and hybrid work, the pursuit of greater affordability, and a strong desire for more space and a higher quality of life. This trend is creating consistent, widespread demand across multiple real estate asset classes.


The fundamental dynamic is a powerful demographic pull. As talent and families relocate, they create an immediate need for housing, driving demand for single-family rentals and build-to-rent communities. This residential growth then acts as a catalyst for commercial development, requiring new neighborhood retail centers, medical office buildings, and last-mile industrial facilities to service the expanding population. Markets like the suburbs of Phoenix, Charlotte, and the Dallas-Fort Worth exurbs exemplify this pattern, showcasing robust and sustained growth that savvy investors can strategically harness.


Investor Checklist: Questions to Ask a Sponsor


To effectively invest in suburban growth corridors, it is crucial to identify markets with durable, long-term growth drivers rather than temporary population spikes.


  • Follow the Infrastructure: Track municipal and state transportation investments. New highway expansions, light rail extensions, or interchange improvements are leading indicators of a city’s commitment to supporting population growth in a specific direction, unlocking previously inaccessible land for development.

  • Evaluate School District Ratings: For residential investments, school quality is a primary driver for family migration. Use platforms like GreatSchools or Niche to analyze performance and funding trends. Suburbs with consistently top-rated school districts often command premium rents and property values with lower volatility.

  • Monitor Commercial Development: Pay close attention to announcements of new grocery stores, large-format retailers, or hospital satellite campuses. These commercial anchors validate the residential growth thesis and signal that an area is reaching a critical mass of economic activity, creating further real estate demand.

  • Identify Master-Planned Communities: Large-scale master-planned communities (MPCs) are powerful engines of suburban growth. Their comprehensive infrastructure and built-in amenities create a strong, localized ecosystem that can outperform the broader market. Investing in or adjacent to these developments provides a built-in demand pipeline.


4. Gateway Cities - Major Metropolitan Hubs


For investors prioritizing stability, liquidity, and long-term capital preservation, gateway cities remain one of the best markets for real estate investment. These are major metropolitan hubs like New York, Los Angeles, and Chicago, which serve as national centers for finance, culture, and commerce. Characterized by deep, diverse economies and high barriers to entry, these markets attract significant institutional capital from around the globe, providing a reliable floor for asset values and consistent tenant demand across economic cycles.


The core appeal of gateway cities lies in their resilience. Their massive and varied economic bases, anchored by industries like finance, tech, education, and healthcare, insulate them from the volatility that can affect markets dependent on a single sector. This economic gravity continuously draws in talent, business, and tourism, sustaining demand for all property types, from Class A office and luxury retail to multifamily and industrial logistics. While cap rates may be compressed and growth slower than in emerging hubs, the sheer scale and liquidity of these markets offer unparalleled risk mitigation and portfolio diversification.


Investor Checklist: Questions to Ask a Sponsor


Success in these mature markets requires a granular approach that looks past broad metro-level statistics to find pockets of opportunity.


  • Focus on Submarket and Micro-Neighborhood Analysis: Instead of evaluating "Chicago" as a monolith, analyze specific submarkets like the Fulton Market District or neighborhoods along new transit extensions. Use tools like CoStar or local broker reports to identify areas with superior rent growth, lower vacancy, and planned infrastructure projects that will unlock future value.

  • Identify Value-Add Opportunities: In established areas, the most compelling returns often come from repositioning older assets. Look for Class B or C properties in A+ locations that can be upgraded to meet modern tenant demands for amenities, technology, and sustainability, thereby justifying significant rent increases.

  • Monitor Institutional Capital Flows: Track where large pension funds, sovereign wealth funds, and global REITs are deploying capital. Platforms like Real Capital Analytics (RCA) provide data on major transactions. Following this "smart money" can validate a submarket's long-term potential and indicate strong future liquidity.

  • Evaluate Transit-Oriented Development (TOD): Proximity to major transit hubs is a powerful and durable value driver in dense urban environments. Analyze properties within a 10-minute walk of key subway, commuter rail, or light rail stations, as these assets consistently outperform in both occupancy and rental rates.


5. Vacation and Resort Real Estate Markets


For investors seeking to capitalize on the experiential economy and global travel trends, vacation and resort destinations offer one of the best markets for real estate investment. These markets are driven by strong, often seasonal, demand from tourism and lifestyle buyers, creating opportunities for significant rental income and long-term appreciation. Assets in premier locations like Aspen, Orlando, or Maui benefit from a captive audience willing to pay a premium for proximity to attractions, natural beauty, and luxury amenities.


The fundamental appeal lies in owning an asset in a location where people consistently want to spend their leisure time and disposable income. This dynamic fuels demand for short-term rentals, boutique hotels, and branded residences. Unlike traditional long-term rentals, vacation properties can generate substantially higher nightly rates, particularly during peak seasons. Furthermore, the increasing desire for unique travel experiences has broadened the market beyond traditional hotels, creating a robust ecosystem for professionally managed private rental properties.


ree


Investor Checklist: Questions to Ask a Sponsor


To succeed in this specialized niche, investors must look beyond beautiful scenery and analyze the underlying economic drivers of a tourism-based market.


  • Analyze Historical Occupancy and Pricing: Use data from platforms like AirDNA or Mashvisor to track key performance indicators such as Average Daily Rate (ADR), occupancy rates, and Revenue Per Available Room (RevPAR). Look for markets with stable or growing demand outside of just the absolute peak season.

  • Factor in Seasonal Volatility: Model cash flow with realistic assumptions for both high and low seasons. A successful vacation rental investment must generate enough income during peak months to cover expenses and vacancy periods throughout the rest of the year.

  • Assess Professional Management: The operational intensity of short-term rentals is high. Evaluate and budget for top-tier professional property management services. Their ability to handle marketing, guest services, and maintenance is critical to maximizing revenue and protecting the asset.

  • Monitor Tourism and Travel Indicators: Track data points like airport passenger traffic, local tourism tax revenues, and convention center bookings. These metrics, often available from local tourism boards, provide leading indicators of future rental demand and the overall health of the destination's economy.


6. Affordable Housing and Workforce Housing Markets


For investors seeking stable, recession-resilient returns backed by non-discretionary demand, affordable and workforce housing markets offer one of the most compelling opportunities in real estate investment. These markets are defined by a persistent structural undersupply of housing for moderate-to-low-income renters, including essential workers like teachers, nurses, and first responders. This creates a durable tenant base and consistent occupancy rates, insulating assets from the volatility often seen in luxury property segments.


The fundamental driver is a widening gap between median incomes and rising housing costs in major metropolitan areas. This dynamic ensures that well-located, quality workforce housing remains in high demand, regardless of broader economic cycles. Furthermore, this sector is often supported by government incentives and public-private partnerships, creating favorable financing conditions and reducing downside risk. Investing here is not just a financial strategy; it is an impact-oriented approach that addresses a critical societal need while generating predictable, long-term cash flow.


Investor Checklist: Questions to Ask a Sponsor


To successfully invest in affordable and workforce housing, a nuanced understanding of local policy and specialized financing is crucial. Investors should focus on identifying markets with supportive regulatory frameworks and strong economic fundamentals.


  • Understand Tax Credit Programs: Familiarize yourself with the Low-Income Housing Tax Credit (LIHTC) program, the most significant federal incentive for affordable housing construction and rehabilitation. Understanding how LIHTC equity is syndicated and its compliance requirements is fundamental to underwriting these deals.

  • Partner with Mission-Driven Operators: Collaborate with experienced nonprofit developers or specialized for-profit sponsors like Enterprise Community Partners. These groups possess deep local relationships, navigating complex subsidy applications and ensuring long-term operational success and community acceptance.

  • Research Local and State Incentives: Beyond federal programs, many cities and states offer their own incentives, such as property tax abatements, density bonuses, and soft loans. Analyze these programs to identify markets where the capital stack can be optimized for lower risk and higher social impact.

  • Monitor Housing Policy Changes: Stay informed about legislative developments that could impact the sector. Policy initiatives, such as support for the Neighborhood Homes Investment Act, can significantly influence the viability of affordable housing markets by creating new financing tools for development and preservation. This foresight allows investors to anticipate new opportunities.


7. Industrial and Logistics Real estate


Driven by the relentless expansion of e-commerce and the complete re-engineering of global supply chains, industrial and logistics properties have transitioned from a niche asset class to a core component of institutional portfolios. This sector, encompassing warehouses, distribution hubs, and last-mile fulfillment centers, offers one of the best markets for real estate investment by directly capitalizing on shifts in consumer behavior and corporate strategy. As companies race to shorten delivery times and build more resilient supply networks, demand for modern, well-located industrial space continues to surge.


ree


The fundamental investment thesis is clear: the digital economy requires a massive physical footprint. From massive regional hubs like those in the Dallas-Fort Worth logistics corridor to last-mile facilities near dense urban centers, these assets are the backbone of modern commerce. Unlike other commercial real estate types, the value here is less about foot traffic and more about operational efficiency, location relative to transportation arteries, and the creditworthiness of tenants like Amazon, FedEx, or major third-party logistics (3PL) providers.


Investor Checklist: Questions to Ask a Sponsor


Success in the industrial sector requires a granular understanding of supply chain mechanics and tenant needs. Investors should focus on data that predicts future demand patterns.


  • Analyze E-commerce Corridors: Use data from firms like Prologis or CBRE to identify primary logistics corridors connecting major ports, inland distribution hubs, and population centers. Invest in assets along these critical routes, such as properties in Ontario, California, which serve the West Coast, or warehouses in New Jersey, which support the New York metropolitan area.

  • Evaluate Tenant Credit Quality: The stability of this asset class hinges on the financial strength of its tenants. Prioritize properties with long-term, triple-net (NNN) leases to investment-grade tenants. Review corporate earnings reports and credit ratings for prospective lessees to mitigate vacancy risk.

  • Monitor Supply Chain Trends: Track global trade data, shipping volumes, and corporate announcements about "reshoring" or "near-shoring" manufacturing. These trends directly influence demand for warehouse and distribution space in key North American markets.

  • Assess Automation Readiness: Future-proof assets by targeting facilities with high clear heights (36'+), super-flat floors, and ample power capacity. These features are essential for tenants implementing advanced robotics and automation, making the property more valuable and versatile for long-term leasing.


8. Medical and Healthcare Real estate


Investing in properties specifically designed for healthcare delivery is one of the most resilient strategies for finding the best markets for real estate investment. This non-cyclical sector includes assets like medical office buildings (MOBs), outpatient surgery centers, and senior living facilities. Demand is driven by powerful, long-term demographic trends, primarily the aging of the population and the expansion of healthcare services, making it less susceptible to typical economic downturns.


The core principle is that healthcare is a fundamental need, not a discretionary expense. An aging America requires more consistent and specialized medical care, fueling demand for modern, accessible facilities. This creates a stable and growing tenant base of healthcare systems, physician groups, and specialized operators with strong credit profiles. Furthermore, the shift of medical procedures from traditional hospitals to more cost-effective outpatient settings boosts demand for conveniently located specialist clinics and urgent care centers in both urban and suburban markets.


Investor Checklist: Questions to Ask a Sponsor


To effectively capitalize on this demographic-driven trend, investors must focus on the operational and regulatory nuances that define healthcare real estate.


  • Analyze Demographic Data: Use data from sources like the U.S. Census Bureau and Centers for Medicare & Medicaid Services (CMS) to identify counties and MSAs with a high concentration and projected growth of the 65+ population. Markets in Florida and Arizona are prime examples for senior living, but opportunities exist nationwide.

  • Evaluate Tenant Operator Strength: The success of a medical property is tied to its operator. Scrutinize the financial health, operational history, and patient satisfaction scores of potential tenants. For senior housing, look at occupancy rates and the operator's experience managing similar facilities.

  • Monitor Regulatory Changes: Stay informed on healthcare policy, especially Medicare and Medicaid reimbursement rates. Changes can directly impact tenant profitability and their ability to pay rent. Following publications from healthcare industry associations can provide critical foresight.

  • Assess Proximity to Health Systems: Medical office buildings and clinics affiliated with or located near major hospital campuses often command higher rents and have lower vacancy rates. This "on-campus" or "near-campus" synergy creates a powerful competitive advantage and a built-in referral network.


9. Multifamily Residential (Apartments and Rentals)


For investors prioritizing consistent cash flow and demographic tailwinds, multifamily residential stands out as one of the best markets for real estate investment. Encompassing everything from urban high-rises to suburban garden-style communities, this asset class directly serves a fundamental human need: shelter. The demand is perpetual and often less volatile than commercial sectors, driven by powerful trends like household formation, urbanization, and the increasing preference for renting over owning, particularly among younger generations.


The core investment thesis is built on durable income streams and the potential for capital appreciation. Unlike single-family rentals, multifamily assets offer economies of scale in management, maintenance, and marketing, creating operational efficiencies that can significantly enhance net operating income (NOI). Whether it's a luxury Class A development in a growing sunbelt city like Nashville or workforce housing providing essential accommodations near employment centers, the sector offers diverse strategies to match various risk-return profiles.


Investor Checklist: Questions to Ask a Sponsor


To effectively deploy capital in the multifamily space, investors must look beyond surface-level occupancy rates and dig into the drivers of sustainable rental growth.


  • Target Value-Add Opportunities: Focus on Class B and C properties in well-located submarkets. These assets often present opportunities to increase NOI by making strategic capital improvements, upgrading unit interiors, and professionalizing management. This strategy allows investors to force appreciation rather than relying solely on market lift.

  • Analyze Rent Growth and Demographics: Use data from sources like CoStar or Yardi Matrix to track real-time rent growth, absorption rates, and new supply pipelines. Cross-reference this with U.S. Census data to identify markets with strong in-migration and job growth, ensuring future tenant demand.

  • Scrutinize Property Management: The performance of a multifamily asset is heavily dependent on the operator. Diligently evaluate the property management company’s track record, tenant satisfaction metrics, and technological capabilities. An elite operator can unlock hidden value that others miss. For a deeper analysis, you can learn more about investing in multifamily properties from Stiltsville Capital.

  • Assess the Regulatory Landscape: Be acutely aware of the local and state regulatory environment, particularly concerning rent control or stabilization policies. Markets with landlord-friendly regulations provide greater predictability and control over an asset's financial performance.


10. Mixed-Use and Experiential Real Estate


For investors focused on long-term value and community integration, mixed-use developments have become one of the best markets for real estate investment. These properties are not just buildings; they are curated ecosystems that blend residential, commercial, retail, and entertainment functions into a single, cohesive destination. This creates a powerful synergy where each component drives traffic and value for the others, fostering a vibrant, "live-work-play" environment that is increasingly in demand by modern tenants and consumers.


The core principle is creating a destination that offers convenience and a superior quality of life. By integrating amenities like grocery stores, restaurants, green spaces, and offices within a walkable radius of residences, these developments become self-sustaining economic engines. Projects like Hudson Yards in New York or The Domain in Austin exemplify this trend, proving that well-executed mixed-use assets can command premium rents and achieve higher-than-average occupancy rates across all property types included in the project.


Investor Checklist: Questions to Ask a Sponsor


To successfully invest in or develop mixed-use real estate, a holistic and forward-looking approach is crucial. Investors must analyze the project as a unified commercial district rather than a collection of separate assets.


  • Prioritize Connectivity and Walkability: Evaluate the site's access to public transportation and major thoroughfares. Use walk score tools and demographic data to ensure the location can support a pedestrian-friendly environment that connects residents, workers, and visitors seamlessly.

  • Secure Strong Anchor Tenants: The success of the retail and commercial components often hinges on attracting high-quality anchor tenants. Analyze tenant creditworthiness and look for businesses with proven experiential concepts that will draw consistent foot traffic, such as a popular restaurant group, a unique fitness studio, or a boutique grocer.

  • Balance the "Use" Mix: A successful project requires a carefully calibrated mix of uses tailored to local market demand. Use market studies from firms like CBRE or JLL to determine the optimal ratio of residential units to office space and experiential retail. The right balance ensures diversification and mitigates risk.

  • Engage the Community: Successful mixed-use projects feel authentic to their surroundings. Investigate the developer's community engagement process. Projects that incorporate local feedback, public art, and accessible green spaces tend to foster greater community buy-in and long-term stability.


Top 10 Real Estate Market Types Comparison


Market

Implementation Complexity 🔄

Resource Requirements ⚡

Expected Outcomes 📊

Ideal Use Cases 💡

Key Advantages ⭐

Emerging Tech Hub Markets

Medium — timing & market research required 🔄

Moderate — acquisition capital + local intel ⚡

High appreciation potential; moderate liquidity — ⭐⭐⭐⭐ 📊

Growth-oriented investors seeking appreciation

Lower entry costs; job-driven demand; VC tailwinds

Gentrifying Urban Neighborhoods

High — timing, community & regulatory risk 🔄

Moderate — rehab capital, active asset management ⚡

Strong upside if timed well; variable liquidity — ⭐⭐⭐⭐ 📊

Value-add investors; rehabilitation specialists

Rapid appreciation potential; proximity to urban amenities

Suburban Growth Corridors

Low–Medium — predictable development cycles 🔄

Moderate — land, infrastructure access, moderate CapEx ⚡

Steady, predictable returns; slower appreciation — ⭐⭐⭐ 📊

Buy-and-hold investors; family rental portfolios

Predictable demographics; lower volatility; government incentives

Gateway Cities — Major Metropolitan Hubs

Medium — regulatory complexity but established processes 🔄

High — large capital, institutional competition ⚡

Lower upside, high liquidity and stability — ⭐⭐⭐ 📊

Institutional and income-focused investors

Deep liquidity; recession resilience; diversified economy

Vacation & Resort Real Estate Markets

Medium — seasonality and management intensity 🔄

Medium–High — operating costs, professional mgmt ⚡

High peak-season yields; off-season variability — ⭐⭐⭐ 📊

Short-term rental operators; lifestyle buyers

High seasonal rates; dual-use (personal + rental) appeal

Affordable & Workforce Housing Markets

High — complex financing and regulatory compliance 🔄

Moderate — specialized financing, nonprofit/public partners ⚡

Stable, recession-resistant returns; lower yields — ⭐⭐⭐ 📊

Impact investors; long-term hold strategies

Government incentives; predictable essential demand

Industrial & Logistics Real Estate

Medium — site specificity & tenant requirements 🔄

High — large CapEx, specialized build-to-suit ⚡

Reliable cash flow with e‑commerce tailwinds — ⭐⭐⭐⭐ 📊

Institutional investors; income-focused strategies

Long-term corporate leases; strong structural demand

Medical & Healthcare Real Estate

High — specialized compliance and build standards 🔄

High — capex for specialized facilities; operator partnerships ⚡

Stable, non-discretionary income; low vacancy — ⭐⭐⭐⭐ 📊

Long-term investors partnering with healthcare operators

Essential-service demand; long-term lease profiles

Multifamily Residential (Apartments & Rentals)

Medium — operational scale and tenant management 🔄

Moderate–High — acquisition capital, property mgmt systems ⚡

Consistent monthly cash flow; scalable returns — ⭐⭐⭐⭐ 📊

Income-focused investors; value-add apartment operators

Diversified tenant base; financing availability; tax benefits

Mixed-Use & Experiential Real Estate

Very High — complex development, approvals & phasing 🔄

Very High — large capital ($100M+), long timelines ⚡

High long-term value if successful; long payback period — ⭐⭐⭐⭐ 📊

Institutional developers; placemaking and urban revitalization

Diversified revenue streams; high density value; strong placemaking


Building Your Portfolio with a Strategic Partner


Navigating the landscape of real estate investment requires more than just a map of promising locations. As we've explored, the best markets for real estate investment are not a monolithic group. They are a diverse collection of opportunities, each with its own unique economic drivers, demographic trends, and risk profiles. From the rapid appreciation potential in emerging tech hubs and suburban growth corridors to the steady, inflation-hedging income from multifamily and medical office assets, the path to a resilient portfolio is paved with strategic diversification and specialized expertise.


The key takeaway from our deep dive is this: market selection is only the first half of the equation. The other, more critical half is execution. An exceptional market can yield mediocre results with the wrong strategy, while a disciplined operator can unlock significant value even in a competitive environment. True success hinges on the ability to translate market data into actionable underwriting, to source deals that others miss, and to manage assets with an owner’s mindset.


From Macro Trends to Micro Execution


Identifying a strong market is about recognizing macro tailwinds, such as population growth in the Sunbelt or the supply-demand imbalance in workforce housing. However, capitalizing on these trends requires granular, street-level knowledge.


  • Risk: Illiquidity

  • Mitigation: Investing with a long-term horizon (typically 5-10 years) and ensuring the capital is not needed for short-term liabilities. Experienced sponsors also build in multiple exit strategies into their underwriting.

  • Risk: Execution Risk

  • Mitigation: Partnering with an experienced sponsor with a proven track record in the specific asset class and geographic market. Thorough due diligence on the sponsor's team, past performance, and "skin in the game" is critical.

  • Risk: Concentration Risk

  • Mitigation: Diversifying investments across multiple markets, asset types, and sponsors. For family offices, this means building a portfolio of passive investments rather than concentrating capital in a single deal.

  • Risk: Market Downturns

  • Mitigation: Investing in assets with durable demand drivers (e.g., workforce housing, medical office) and conservative leverage. A sponsor's ability to stress-test their underwriting against downside scenarios is a key indicator of discipline.


Final Take: Who You Invest With Matters Most


Investor Take: Your most important investment decision isn’t just where to invest, but who to invest with. An experienced sponsor provides the crucial bridge between a promising market and a profitable asset, mitigating execution risk and aligning interests for long-term value creation.

Ultimately, identifying the best markets for real estate investment is the beginning of a journey. The destination, a resilient and high-performing real estate portfolio, is reached through disciplined execution, rigorous underwriting, and partnership with a team that has navigated multiple market cycles. This strategic alignment transforms a good idea into a great investment, creating a durable foundation for long-term wealth preservation and growth. Well-structured real assets can be a prudent, resilient component of your long-term wealth strategy.


Take the Next Step


Ready to move from market analysis to portfolio construction? At Stiltsville Capital, we provide accredited investors access to institutional-quality real estate opportunities across carefully selected high-growth markets. Schedule a confidential call with our team to explore how our disciplined strategies can help you achieve your investment goals.


Schedule a Confidential Call with Stiltsville Capital


Information presented is for educational purposes only and does not constitute an offer to sell or a solicitation of an offer to buy securities. Any offering is made only through definitive offering documents (e.g., private placement memorandum, subscription agreement) and is available solely to investors who meet applicable suitability standards, including “Accredited Investor” status under Rule 501 of Regulation D. Investments in private real estate involve risk, including loss of capital, illiquidity, and no guarantee of distributions. Past performance is not indicative of future results. Verification of accredited status is required for participation in Rule 506(c) offerings.


Corporate Office

30 West Mashta Drive | Suite 400

Key Biscayne, FL 33149​​

Tel: 786.316.9840

© 2025 Stiltsville Capital LLC

Stiltsville Capital LLC_logo_black

Disclosures

​​​Success Stories and Testimonials are intended to demonstrate our firms professional experience and history of providing exceptional service to their clients and reflect the collective experience of Stiltsville Capital, LLC's Principals and Team members and may include transactions/clients they have worked with directly at previous firms.

Stiltsville Capital, LLC and its affiliates do not provide tax or legal advice. Information contained on this website is provided for educational and illustrative purposes only and cannot be relied upon to avoid tax penalties. Please consult your tax and legal advisors to determine how this information may apply to your own situation. Whether any planned tax result is realized by you depends on the specific facts of your own situation at the time your tax return is filed. 


Real estate and private equity investments have special risks, including possible illiquidity of the underlying properties, credit risk, interest rate fluctuations, and the impact of varied economic conditions and may not be suitable for all investors.

bottom of page