How to Calculate Internal Rate of Return: A Guide for Real Estate Investors
- Ryan McDowell

- Oct 7, 2025
- 12 min read
Reading Time: 8 min | Good for: A, B
TL;DR: Key Takeaways on IRR
What It Is: The Internal Rate of Return (IRR) is the true annualized return of an investment, accounting for the timing and size of all cash flows (both in and out).
Why It Matters: IRR allows investors to compare vastly different real estate projects—like a short-term multifamily renovation and a long-term data center development—on a true apples-to-apples basis.
How to Calculate It: Use the or, more accurately, the function in Excel or Google Sheets by listing all your cash outflows (negative) and inflows (positive) over time.
The Next Step: Once you have the IRR, you must compare it to a risk-appropriate "hurdle rate" and analyze the assumptions behind the number.
The Market Why-Now: Why Precision in Returns Matters
In today's capital markets, understanding the true return profile of an asset is more critical than ever. According to CBRE's 2024 U.S. Investor Intentions Survey, over 60% of investors expect to either maintain or increase their allocation to real estate. With more capital chasing deals, the ability to accurately underwrite and compare opportunities is what separates successful investors from the rest. The IRR is a foundational tool in this process, helping you see past simple profit multiples to understand the velocity of your capital and its true growth rate.
What Is IRR and Why It Matters for Investors

The Internal Rate of Return (IRR) is arguably the single most important metric for sizing up the profitability of a real estate deal. In technical terms, it's the discount rate that makes the Net Present Value (NPV) of all cash flows equal to zero.
Novice Lens / Why It Matters:Think of IRR as the actual growth rate of your money. It answers the fundamental question, "What annual return am I getting on every dollar I have tied up in this project?" An investment that returns $100,000 in two years is a completely different animal from one that returns the same amount in five, and IRR is the tool that shows you precisely why. It’s the great equalizer, letting you compare a five-year apartment project against a ten-year data center development.
For sophisticated family offices and institutional players (Persona B/C), IRR plays a more technical role. It’s a core component of capital budgeting, used to vet potential deals against a pre-set hurdle rate—the absolute minimum return they’ll accept for an investment with a certain risk profile. If a project’s projected IRR can’t clear that hurdle, it’s a hard pass.
The Essential Inputs for an IRR Calculation
Whether you're using a back-of-the-napkin spreadsheet or sophisticated financial modeling software, every IRR calculation boils down to a few key inputs. Without these pieces, you're just guessing.
Initial Investment (Year 0): The total cash you put in upfront. This includes the purchase price, closing costs, and any day-one renovation funds. It's always a negative number (e.g., -$2,500,000).
Ongoing Cash Flows: The net cash generated by the property over the holding period (usually annually). This is your rental income minus all operating expenses (e.g., Year 1: $150,000, Year 2: $175,000).
Final Year Cash Flow (Exit Value): The big payday at the end. This is a combination of the final year's net operating income plus the net proceeds from selling the property (e.g., Year 5: $3,500,000).
Getting these three inputs right is the foundation of a reliable IRR calculation. The concept of IRR first popped up in the mid-20th century as modern finance took shape. Fast forward to today, and it’s a cornerstone of investment decisions across the globe. For instance, in stable, developed markets, an IRR above 10% is often considered a solid benchmark, as it aligns well with the historical average returns of other major asset classes.
Mapping Your Investment Cash Flows for an Accurate IRR
Before you can calculate anything, you need a precise map of every dollar that moves in and out of your investment. This cash flow timeline is the absolute bedrock of a reliable IRR calculation. Get this part wrong, and your final number will be misleading, no matter how fancy your spreadsheet is.
It all starts with that first transaction. This is your initial investment, a negative cash flow that happens at "Year 0." It represents the total capital you put into the deal—the purchase price, closing costs, and any upfront funds for renovations or improvements.
Charting the Project's Financial Journey
With the initial outlay recorded, the next step is to project the annual cash flows for the entire time you plan to hold the property. For most commercial real estate deals, this means forecasting the Net Operating Income (NOI). You’ll project rental income and then subtract all anticipated operating expenses and recurring capital improvements to land on the net cash flow for each year.
To really nail this, you need a solid grasp of how different financial activities play out. The pros often lean on their ability to read financial health through detailed reports, like in this guide to understanding cash flow statements. This foundational knowledge makes sure your projections are both comprehensive and realistic.
Investor Take: Every cash flow projection is built on assumptions about rent growth, vacancy rates, and expense inflation. A sharp sponsor will stress-test these assumptions, showing you how the IRR holds up in different market scenarios. This reveals the true risk profile of the deal far better than a single, optimistic number.
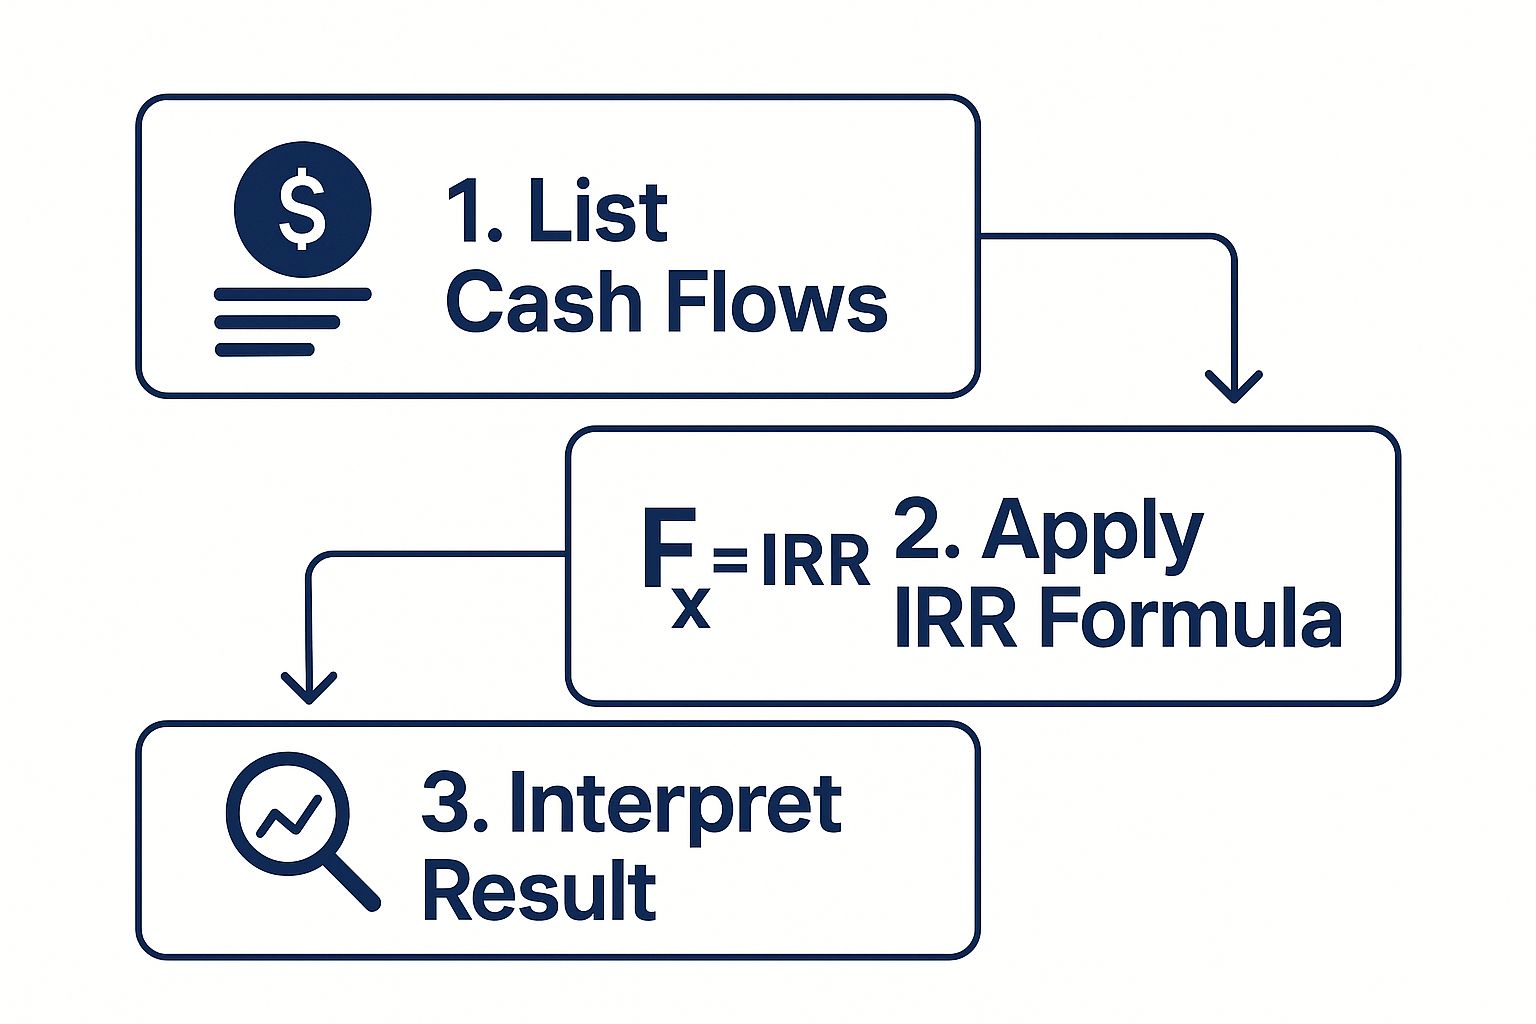
The simplified process below shows how to move from listing these cash flows to arriving at an actionable IRR.

This visual really drives home the point that the calculation itself is just one piece of the puzzle. The quality of the cash flow data you feed into it is what truly determines the reliability of the final result.
Deal Lens: A Five-Year Multifamily Example
Let's make this real with a quick, illustrative example. Imagine we're looking at a five-year value-add multifamily project. The cash flow timeline might look something like this, with each entry representing the net cash moving to or from the investor.
Here's a simple layout you'd see in a spreadsheet:
Year 0 (Initial Investment): -$2,000,000
Year 1 (Stabilization): $120,000
Year 2 (Increased Rents): $150,000
Year 3 (Steady Operations): $160,000
Year 4 (Steady Operations): $165,000
Year 5 (Sale & Final Income): $3,000,000
Notice how the cash flows evolve. They reflect the value-add strategy—lower initial returns during renovation followed by higher, stabilized income. This dynamic modeling is far more precise than simple averaging and is a key concept related to the time value of money, which you can explore further in our guide to calculating a discounted cash flow for real estate.
The Critical Final Year Cash Flow
The most significant number on that list is often the cash flow in the final year. That isn't just the property's income for the year; it's a combination of the annual NOI plus the net proceeds from the sale. The sale proceeds are calculated by taking the projected sales price and subtracting the remaining loan balance and transaction costs, like brokerage fees.
An overly aggressive exit assumption can dramatically inflate a project's IRR, making a mediocre deal look fantastic. This is exactly why savvy investors spend so much time scrutinizing the exit cap rate and sales price assumptions. A small tweak to this single number can have an outsized impact on the entire return profile.
How to Calculate IRR Using Excel and Google Sheets
Once you have your cash flow timeline mapped out, you’re ready for the fun part: the actual calculation. Don't worry, you won’t need a fancy financial calculator or a math degree. The tools you already use every day—Microsoft Excel and Google Sheets—have everything you need to find the IRR quickly and accurately.

Let's walk through how to do this using our multifamily project example from before. We'll focus on the two essential formulas you'll need: `IRR` and `XIRR`. Knowing when to use each one is the key to getting a result you can trust.
Using the Standard IRR Function
The standard function is your go-to for simple deals with evenly spaced cash flows. Think of a project that pays out exactly once a year, on the same date, without fail. It's clean, simple, and perfect for these straightforward scenarios.
To calculate it for our five-year project, you’d just list the cash flows in a single column in your spreadsheet:
Cell A1: -2,000,000 (Your initial investment)
Cell A2: 120,000 (Year 1)
Cell A3: 150,000 (Year 2)
Cell A4: 160,000 (Year 3)
Cell A5: 165,000 (Year 4)
Cell A6: 3,000,000 (Year 5, including the sale)
Then, in any blank cell, just type the formula: . Excel or Sheets will do the heavy lifting and spit out the answer, which in our case is 19.86%. This figure is the project's annualized return, but it's based on the assumption that every cash flow period is identical.
Novice Lens: The Most Common MistakeA frequent slip-up is entering the initial investment as a positive number. For the IRR formula to work, cash outflows (like your investment) must be negative, and inflows must be positive. If every number has the same sign, you’ll just get an error. Always double-check that your initial cash out is a negative value.
Why XIRR Is the Superior Tool for Real Estate
Here’s the thing about real estate: it's rarely that neat and tidy. Capital calls happen when they happen, you might close on a property in March, and then sell it in October five years down the line. Those irregular dates can throw off the standard IRR calculation, sometimes significantly.
This is exactly where the function becomes your best friend. It’s specifically built for cash flows that don't stick to a rigid schedule. The "X" in XIRR accounts for the exact timing of each cash flow, giving you a much more precise and realistic rate of return.
To use it, you'll need two columns: one for the cash, one for the dates.
Date (Column A) | Cash Flow (Column B) |
|---|---|
01/15/2024 | -2,000,000 |
12/31/2024 | 120,000 |
12/31/2025 | 150,000 |
12/31/2026 | 160,000 |
12/31/2027 | 165,000 |
10/31/2028 | 3,000,000 |
Your formula would look like this: . See how it needs two pieces of information? It pairs each cash flow amount with its corresponding date. This level of detail is why XIRR is the gold standard for accurately modeling real-world real estate deals.
Of course, if you'd rather skip the formulas, a dedicated real estate investment calculator can give you the IRR and other key metrics without having to build a spreadsheet from scratch.
Advanced Lens: The 'Guess' ArgumentIn rare cases with very unusual cash flows (like a large negative cash flow in the middle of a project), the IRR algorithm can sometimes struggle to solve the equation. The function has an optional "guess" argument, like . By giving it a starting point (e.g., 0.1 for 10%), you can nudge the function toward the correct answer. You'll almost never need this for a typical real estate project, but it’s a handy trick to have in your back pocket for complex modeling.
Interpreting Your IRR: What the Number Really Means

Running the numbers in your spreadsheet to get an Internal Rate of Return is a crucial step, but it's really just the beginning. The real skill—the kind that separates amateur investors from seasoned pros—is knowing what that number actually says about a deal's potential and its underlying risks.
An 18% IRR might look great on paper, but context is everything. Is that 18% coming from a stable, cash-flowing apartment building or a speculative, ground-up development? The answer completely changes how you should view that return.
Benchmarking Against the Hurdle Rate
Your first reality check should always be the hurdle rate. Think of this as your minimum acceptable return for a project, considering its unique risk profile. It’s the bar that a deal’s projected IRR has to clear before it’s even worth a second look.
This rate isn’t one-size-fits-all; it changes based on the investment strategy.
Core Strategy: For a fully leased office building in a prime location with a credit-worthy tenant, the risk is low. Your hurdle rate might be in the 8% to 10% range.
Value-Add Strategy: Taking on a multifamily property that needs renovation and lease-up? That has more execution risk. Here, the hurdle rate climbs higher, maybe into the 12% to 15% range.
Opportunistic Strategy: A ground-up development with entitlement risk and zero cash flow from day one is the riskiest play. Investors will demand a much higher return, so the hurdle rate could easily be 20% or more.
Investor Take: A deal's IRR should never be evaluated in a vacuum. The first question should always be, "Does this return adequately compensate me for the risk I'm taking?" A 14% IRR on a core asset is fantastic. That same 14% IRR on an opportunistic deal is a clear sign to walk away.
Understanding the Reinvestment Assumption
The single biggest weakness of the IRR calculation is its built-in assumption about reinvestment. The formula quietly assumes that every dollar of cash flow you receive—those annual distributions—can be immediately reinvested at the exact same rate as the project's IRR.
So, if your project has a 20% IRR, the math pretends you can take every distribution check and find another investment that also generates a 20% return. In the real world, consistently finding those kinds of opportunities is next to impossible. This quirk often makes the IRR look a little more optimistic than reality. Because of this, savvy investors often bring in another metric to get a clearer picture.
The IRR and Equity Multiple Balancing Act
A high IRR can sometimes be misleading, particularly on short-term projects. You might hit a 25% IRR on a quick one-year flip, but the total profit you walk away with could be relatively small. On the other hand, a longer-term deal might show a lower IRR of 17% but generate a much larger pile of cash over its lifetime.
This is exactly why IRR should always be looked at alongside the Equity Multiple.
IRR tells you how fast your money is working.
Equity Multiple tells you how much money you get back in total.
For instance, an Equity Multiple of 2.0x means you’ve doubled your initial investment. A truly effective analysis uses both. The best deals deliver not just a strong IRR but also a healthy Equity Multiple. To really nail this concept, check out our detailed guide on the equity multiple formula in real estate.
Common IRR Mistakes and How to Avoid Them
A high IRR on paper means absolutely nothing without a rock-solid understanding of the assumptions propping it up. A rosy exit cap rate or an aggressive rent growth forecast can easily juice the IRR, making an average deal look like a grand slam. This is exactly why the due diligence process is so important.
Key Risks & Mitigations When Analyzing IRR
Risk: Overly Optimistic Assumptions * Mitigation: Insist on seeing the sponsor's sensitivity analysis. Ask how the IRR changes if rent growth is 1% lower or the exit cap rate is 50 basis points higher. A transparent sponsor will have this data ready.
Risk: Comparing Dissimilar Projects * Mitigation: Always evaluate IRR in the context of the deal's risk profile (Core, Value-Add, Opportunistic). A lower IRR on a safer asset is often a superior risk-adjusted return.
Risk: Ignoring Reinvestment Realities * Mitigation: Use the Equity Multiple as a complementary metric. This will show you the total wealth creation of a project, which is especially important for longer-hold investments where IRR can be less informative.
Investor Checklist: Questions to Ask a Sponsor
When a sponsor slides a pro forma across the table showing a juicy IRR, that’s not the end of the analysis—it’s the beginning of a conversation. Your job is to pressure-test their model and find its weak points.
"What are the core assumptions driving these cash flows? Specifically, where are you getting your numbers for rent growth, vacancy, and operating expense inflation?"
"How did you land on the exit cap rate? What are the historical cap rates for this type of asset in this specific submarket?"
"How much does the IRR change if the exit cap rate is a point higher, or if the sale is delayed by six months?"
"Are the capital expenditure budgets based on actual contractor bids, or are they estimates? Did you build in a contingency?"
Having a complete framework for vetting deals is non-negotiable. You can dive deeper with our guide on how to evaluate investment opportunities, which builds on these critical diligence steps.
Diving Deeper: Your IRR Questions Answered
What’s the Real Difference Between IRR and ROI?
Return on Investment (ROI) is a simple, static number. It tells you how much money you made as a percentage of what you put in, but it completely ignores how long it took to get it back. IRR, on the other hand, is all about time. It's a dynamic, annualized rate. Imagine two deals. One doubles your money in two years, and the other doubles your money in seven years. Both have the exact same 2.0x ROI. But the IRR on the two-year deal is drastically higher because it got your capital back to you faster.
Can IRR Be Negative? And What Does That Mean?
Absolutely. A negative IRR is an unmistakable sign that the investment lost money. It means the total cash you got back from the project was less than the total cash you put in. It's a clear signal that the deal failed to clear even a 0% return hurdle, resulting in a net loss of capital.
Why Would a Project Have Multiple IRRs?
This is a technical quirk that can happen in complex deals with non-standard cash flows (e.g., a large capital call in the middle of a project). If the cash flow stream flips from positive to negative more than once, it can create a situation where more than one discount rate can solve the IRR equation. In these rare cases, it's smart to lean on other metrics like Net Present Value (NPV) or Modified Internal Rate of Return (MIRR) to get a clearer picture.
How Does Debt Change the IRR Calculation?
Using debt—or leverage—can supercharge the IRR on your equity, but you have to calculate it the right way. You need to shift your focus from the property's overall returns to the specific returns on your equity stake. This is the "levered IRR." To find it, your cash flow timeline must track only the money that actually comes out of or goes into your pocket: your down payment, your cash flow after mortgage payments, and your final proceeds after the loan is paid off.
Well-structured real estate assets can be a prudent, resilient component of a long-term wealth strategy. At Stiltsville Capital, we believe a deep understanding of metrics like IRR is fundamental to making prudent investment decisions. Our disciplined approach ensures every opportunity is rigorously underwritten to identify its true potential and its fit within a diversified portfolio.
If you are an accredited investor looking to access institutional-grade real estate deals, we invite you to explore our approach.
Information presented is for educational purposes only and does not constitute an offer to sell or a solicitation of an offer to buy securities. Any offering is made only through definitive offering documents (e.g., private placement memorandum, subscription agreement) and is available solely to investors who meet applicable suitability standards, including “Accredited Investor” status under Rule 501 of Regulation D. Investments in private real estate involve risk, including loss of capital, illiquidity, and no guarantee of distributions. Past performance is not indicative of future results. Verification of accredited status is required for participation in Rule 506(c) offerings.


Comments