How to Calculate Cap Rate: A Guide for Real Estate Investors
- Ryan McDowell
- Dec 11, 2025
- 15 min read
Reading Time: 8 min | Good for: Novice (A), Informed (B), Sophisticated (C)
TL;DR: Key Takeaways
What It Is: The capitalization (cap) rate is a fundamental metric in commercial real estate, showing a property's unleveraged annual return. It's the fastest way to compare the potential profitability of different assets.
How to Calculate It: The formula is simple: Cap Rate = Net Operating Income (NOI) / Property Value. A property with a $100,000 NOI and a $2,000,000 price has a 5% cap rate.
Why It Matters: It provides a standardized benchmark to gauge risk and return. Lower cap rates typically mean lower risk and higher value, while higher cap rates suggest higher potential returns but often come with more risk.
Investor Action: Use the cap rate formula to quickly vet deals, but always dig deeper into the assumptions behind the NOI and the market cap rate. Never take a sponsor's numbers at face value.
In real estate investing, success often boils down to answering one question with confidence: is this a good deal? The cap rate is your first, best answer.
Calculating it is deceptively simple: divide the property's Net Operating Income (NOI) by its purchase price or current market value. But don't let the basic math fool you. This single number is one of the most powerful tools in your arsenal, giving you an unleveraged, apples-to-apples snapshot of a property's earning power.
Breaking Down the Core Cap Rate Formula
Think of the capitalization rate as the universal language for comparing income-producing properties. It’s what lets us cut through the noise of different financing terms, tax situations, and property sizes to see the raw, underlying performance of the asset itself. This is what allows you to intelligently compare a 100-unit multifamily building in Austin with a medical office building in Atlanta on an even playing field.
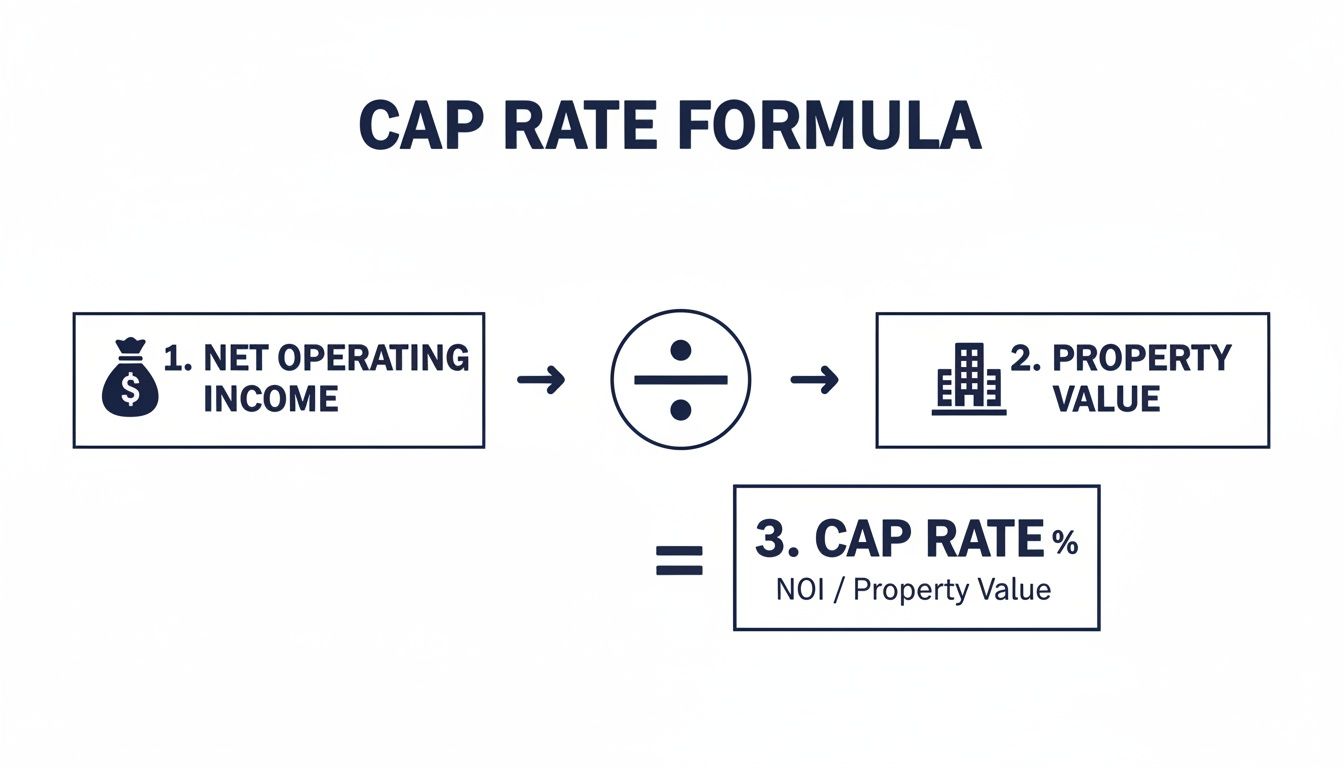
The formula itself couldn't be simpler:
Cap Rate = Net Operating Income (NOI) / Property Value
So, if you're looking at a building that generates $80,000 a year in NOI, and the seller wants $1,000,000 for it, you're looking at an 8% cap rate. That means for every dollar you invest, you can expect an 8-cent return that year—before you factor in your mortgage payment or taxes.
For a more detailed primer on the concept, check out our introductory guide: what is a capitalization rate.
To help you get comfortable with the inputs, here’s a quick summary of what goes into the formula and what it really means for you as an investor.
Cap Rate Formula Components at a Glance
Component | Definition | Investor Takeaway |
|---|---|---|
Net Operating Income (NOI) | All property revenue minus all reasonably necessary operating expenses. | This is the pure, unleveraged income the property generates on its own. It's the truest measure of an asset's operational performance. |
Property Value | The purchase price you're paying or the asset's current estimated market value. | This is your total investment basis. You're trying to figure out if the NOI justifies this price tag. |
This simple breakdown shows how the formula connects a property's operational efficiency (NOI) directly to its market price (Value), giving you a clear picture of its potential return.
Why This Little Number Is a Big Deal
So, why do experienced investors obsess over this one metric?
It’s a Standardized Benchmark: Cap rates create a level playing field. It's the fastest way to vet multiple deals and see which ones are even worth a deeper look, regardless of their size or financing structure.
It’s a Quick Risk Gauge: Generally, a higher cap rate can point to higher potential returns, but it often comes with more risk—perhaps the property is in a less desirable location or needs significant work. A lower cap rate usually signals a safer, more stable "trophy" asset.
It’s a Market Thermometer: Watching cap rate trends in a market tells you a story. When cap rates are compressing (going down), it means property values are rising faster than income—a sign of a hot market. When they expand (go up), it can signal a market slowdown.
Getting a firm grip on this formula is step one in becoming a disciplined underwriter. Financial ratios are the language of investing, and understanding the importance of ratio analysis in financial understanding is a foundational skill. It's how you learn to read between the lines and truly interpret what the numbers are telling you about a deal's potential.
Calculating Net Operating Income Accurately
The Net Operating Income (NOI) is the absolute engine of the cap rate formula. Getting it right is non-negotiable.
If your NOI is flawed, your valuation will be flawed, and you'll be making decisions based on bad data. Plain and simple. Think of NOI as the property's true, unleveraged annual profit—what it earns before you account for any mortgage payments or income taxes.
The calculation always starts at the top line: the total income a property could possibly generate if it were 100% occupied with every single tenant paying rent on time. This is your Gross Potential Rent (GPR).
From Potential to Reality
Of course, no property is ever 100% full with 100% on-time payments. You have to account for the friction of vacancies and tenants who don't pay.
Once you subtract a realistic allowance for vacancy and credit loss from your GPR, you get your Effective Gross Income (EGI). This number is a much more honest picture of the revenue you can actually expect to collect.
But EGI isn't just about rent. You also need to add in any other income the property kicks off—think laundry machines, parking fees, or storage unit rentals. Once you have a firm grip on your EGI, it’s time to subtract the costs of actually running the building.
This simple visual shows how a property’s real income stream (NOI) is directly tied to its value, forming the very core of your initial analysis.
Distinguishing OPEX from CAPEX
This is where many new investors get tripped up. To calculate an accurate NOI, you must subtract all the true operating expenses (OPEX). These are the recurring, day-to-day costs needed just to keep the lights on and the property maintained.
Typical operating expenses include things like:
Property Taxes
Insurance Premiums
Property Management Fees
Utilities (if not passed on to tenants)
Routine Repairs & Maintenance
Landscaping and Janitorial
General Administrative Costs
What’s crucial to remember is that OPEX does not include capital expenditures (CAPEX). CAPEX refers to the big-ticket, one-off investments that improve the asset or extend its life—things like a new roof, repaving the parking lot, or a full HVAC system replacement.
Confusing the two can dangerously inflate your NOI and give you a wildly optimistic—and wrong—view of a property's performance. For a much deeper dive, our guide on how to find net operating income lays it all out clearly.
Insight Edge: The Art of "Normalizing" NOIWhen we underwrite a deal, we almost never take the seller's provided NOI at face value. We "normalize" it. This just means adjusting their numbers to reflect a more stable, long-term reality. For instance, if a seller hasn't fixed anything in a year to make their expenses look artificially low, a smart investor adds a realistic maintenance budget back in. If rents are way below market, we might adjust the income upward to reflect the property's true potential after a few lease renewals. This process of normalization is what gives you a credible baseline for calculating a cap rate you can actually trust.
Putting Cap Rate to Work: Three Real-World Scenarios
Knowing the formula is one thing, but the real skill is applying it to live deals. How you calculate and interpret a cap rate changes drastically depending on the asset, the market, and your strategy.
Let's walk through three distinct deals to see how this plays out on the ground.
This is where investors shift from simple math to strategic underwriting. Each case—a steady core asset, a value-add project, and a ground-up development—demands a completely different lens.
Scenario 1: The Stabilized Multifamily Asset (Core Strategy)
Picture a 200-unit apartment building in a strong submarket. It’s humming along at 95% occupancy, expenses are predictable, and no major repairs are needed. This is a classic "stabilized" or "core" asset.
Calculating the cap rate here is straightforward because you're working with real, historical numbers from the property’s trailing twelve-month (T-12) financial statement.
Gross Potential Rent: $3,600,000/year
Vacancy & Credit Loss (5%): -$180,000
Effective Gross Income (EGI): $3,420,000
Operating Expenses: -$1,200,000
Net Operating Income (NOI): $2,220,000
If the seller has it listed for $44,400,000, the math is simple:
$2,220,000 (NOI) / $44,400,000 (Value) = 5.0% Cap Rate
For a property like this, the cap rate gives you an immediate snapshot of the current, unleveraged yield. Your job as an investor is simply to decide if a 5.0% return is a fair trade for the risk of owning this specific building in this specific market.
Scenario 2: The Value-Add Retail Center
Now let's switch gears to a neighborhood retail center. It has some empty storefronts, and the existing tenants are paying rents that are well below the market rate. This is a classic "value-add" play.
The current numbers don't tell the whole story. The real potential is what you can turn it into. Here, we need to calculate a pro forma cap rate, which is based on the projected NOI after we've put our business plan into action.
Current (Actual) NOI: $450,000
Purchase Price: $7,500,000
Current Cap Rate: 6.0% ($450,000 / $7,500,000)
Our plan is to inject $1,000,000 into renovations to modernize the facade, improve signage, and attract better tenants. We also plan to negotiate higher rents with the existing ones. We project that after about 18 months, we can hit a stabilized NOI of $680,000.
The most important metric for a deal like this is the yield on cost. This tells us the return on our total investment.
Projected NOI / Total Cost = Yield on Cost$680,000 / ($7,500,000 + $1,000,000) = 8.0%
This 8.0% yield on cost is what justifies the risk, headache, and capital outlay of the renovation. We're actively creating value by forcing the NOI higher. The goal is to later sell the stabilized asset at a lower market cap rate (say, 6.5%) and pocket the difference.
Scenario 3: The Opportunistic Development Deal
Finally, the riskiest of the bunch: an opportunistic development. Let's say we're building a new medical office building from the ground up. There's no NOI, no rent roll, no history.
The entire valuation hinges on one critical assumption: the exit cap rate. This is the cap rate we believe a future buyer will be willing to pay for the property once it's built, leased up, and running smoothly.
Project Total Development Costs: We estimate it will take $20,000,000 to build and lease up the project.
Estimate Stabilized NOI: Based on detailed market rent studies and operating expense forecasts, we believe the property will generate a stabilized NOI of $1,500,000 about three years from now.
Determine Market Exit Cap Rate: We analyze recent sales of similar new medical office buildings and land on a conservative exit cap rate assumption of 6.0%.
With these assumptions, we can estimate our future sale price.
Projected NOI / Exit Cap Rate = Estimated Sale Price$1,500,000 / 6.0% = $25,000,000
The potential profit is the difference between this projected sale price and our total cost—in this case, $5 million. For development deals, the accuracy of your exit cap rate assumption is everything. Being off by even a small margin can completely change your projected returns and might be the difference between a home run and a total bust.
Using Cap Rates to Determine Property Value
Once you get the hang of calculating a cap rate, you can flip the script and use it for one of its most powerful applications: valuing a property. This isn't just a party trick for real estate nerds; it's a core valuation method that appraisers, brokers, and institutional investors use every single day.
This approach is called Direct Capitalization. It’s a beautifully simple way to translate a property’s income stream (its NOI) into a hard dollar value using a single, market-driven rate.
The formula is just a quick rearrangement of the one we've been using:
Property Value = Net Operating Income (NOI) / Market Cap Rate
Let's say you're looking at a building that generates a steady $500,000 in NOI. You've done your homework and found that similar properties in the neighborhood are trading at a 6.25% cap rate. The math is straightforward: the estimated value is $8,000,000 ($500,000 / 0.0625).
This gives you a quick, data-backed baseline for what a property is worth in today's market.
Where to Find a Credible Market Cap Rate
The real art and science here isn't the division—it's finding a credible, defensible market cap rate. Your entire valuation hinges on this input. A number pulled from thin air will give you a valuation that's just as meaningless.
So, where do the pros get their data?
Brokerage Research Reports: Major firms like CBRE, JLL, and Cushman & Wakefield publish quarterly reports that are treasure troves of cap rate trends across different property types and cities.
Comparable Sales Analysis: This is the most boots-on-the-ground method. You dig into recent sales of similar properties (the "comps") in your specific submarket to see what cap rates other buyers were willing to pay.
Subscription Databases: Serious players use services like CoStar and Real Capital Analytics. These platforms offer massive databases of sales transactions, letting you slice and dice the data to find the exact market rates you need.
Understanding what’s behind these numbers is just as important as the numbers themselves. Cap rates aren't static; they move with economic cycles, interest rates, and overall investor sentiment. Back in the early 2000s, it wasn't uncommon to see commercial real estate cap rates around 7-8%. After 2010, a decade of low interest rates squeezed those rates down into the 4-6% range, especially in major markets.
What Drives Cap Rates Up or Down?
Ever wonder why two buildings that look almost identical on paper might trade at completely different cap rates? The market is pricing risk and growth potential into that single number.
The table below breaks down the key factors that push cap rates higher or lower.
Factors Influencing Market Cap Rates
Factor | Impact on Cap Rate | Investor Consideration |
|---|---|---|
Asset Quality & Location | Lower for Class A in prime spots; Higher for Class C in tertiary markets. | High-quality assets are seen as safer, justifying a lower initial return (lower cap rate). |
Tenant Strength | Lower for long-term leases with credit tenants (e.g., Walgreens, Amazon). | A reliable income stream from a strong tenant significantly reduces investment risk. |
Market Growth | Lower in markets with strong job and population growth (e.g., Sun Belt cities). | Investors will pay more (accept a lower cap rate) for the potential of future rent growth. |
Economic Outlook | Higher during recessions or periods of high interest rates. | Uncertainty and higher borrowing costs demand a higher risk premium (higher cap rate). |
Asset Condition | Higher for properties needing significant capital expenditures (e.g., new roof, HVAC). | The buyer needs a higher return to compensate for the upcoming capital outlay and risk. |
Essentially, the market is constantly balancing risk and reward.
A lower cap rate usually signals higher quality and stronger growth prospects. Think Class A buildings in prime locations with rock-solid tenants. Investors see them as safer bets and are willing to pay a premium, accepting a lower initial return for that stability and upside.
On the flip side, a higher cap rate might point to higher risk—maybe it's an older property that needs a ton of work, or it’s located in a town with a shaky economy.
Learning to read these signals is what underwriting is all about. As you gain experience, you'll develop a gut feeling for what is a good cap rate for a particular deal in a specific market. It's also worth noting how modern marketing can influence a property's perceived value and sale price, with new tools like AI for boosting real estate sales changing the game.
Common Mistakes and Advanced Considerations
Knowing the cap rate formula is one thing. Applying it with institutional discipline is another.
A high cap rate might scream "bargain," but it could just as easily be a trap. A low cap rate could signal a stable, trophy asset—or it could be an overpriced deal with absolutely no room for error. Understanding these nuances is what separates the novices from the pros.
One of the most common blunders we see is the mishandling of capital reserves. If you understate—or worse, completely ignore—a realistic budget for future capital expenditures (CAPEX), you’re just fooling yourself. Things like roof replacements, new HVAC systems, or parking lot resurfacing are inevitable. Leaving them out of the equation artificially inflates your Net Operating Income (NOI), making the property look far more profitable than it really is. This leads directly to a flawed valuation and a bad deal.
An Advanced Look: Cap Rates and Risk Premiums
Advanced Lens (For Sophisticated Investors)
For sophisticated investors, the cap rate isn't just a simple yield metric. It's a direct reflection of the risk premium the market demands for that specific asset, measured against a "risk-free" investment.
The easiest way to think about it is that the cap rate is the yield on a 10-year Treasury bond plus a spread that accounts for all the messy, real-world risks of owning property.
That spread is compensation for factors like:
Illiquidity: You can’t exactly sell a 100-unit apartment building with a single mouse click.
Execution Risk: Will the proposed business plan actually work?
Market Risk: What if that big employer down the street closes up shop?
Tenant Risk: What happens if your anchor tenant decides not to renew their lease?
This relationship is why rising interest rates are such a big deal. When the risk-free rate (like the 10-year Treasury) goes up, it puts upward pressure on cap rates because investors will demand the same—or a higher—premium for taking on all that real estate risk.
Questions to Ask a Sponsor
When you’re looking at a deal from a sponsor like Stiltsville Capital, the assumptions behind their cap rate projections are far more important than the final number itself. A disciplined, experienced underwriter will not only have the answers but will welcome these tough questions.
Investor Checklist:* Exit Cap Rate: How did you land on the projected exit cap rate? Critically, is it higher than the entry cap rate? Building in a conservative cushion here is a sign of a seasoned operator.* CAPEX in NOI: What specific capital expenditures did you include or exclude from your pro forma NOI calculation? Get specific.* Market Comps: Can you show me the comparable sales you used to justify your market cap rate? I want to see the addresses and the math.* Rent Growth: What are your rent growth assumptions? How do those projections stack up against the submarket's historical performance and what third-party forecasts are saying?* Sensitivity Analysis: Have you stress-tested the returns? What happens to the deal if exit cap rates expand by 50 to 100 basis points?
FAQ: Common Questions About Calculating Cap Rate
Even after you get the math down, there are always a few lingering questions about how cap rates work out in the real world. Let's tackle some of the most common ones I hear from investors.
So, What’s a “Good” Cap Rate?
The honest answer? It depends. There’s no magic number here.
A cap rate is entirely relative—it’s a product of the property type, its location, the quality of the building, and the overall economic mood. For instance, a 4.5% cap rate might be a fantastic deal for a brand-new, Class A apartment building in a hot Sun Belt market. That low number reflects intense demand from buyers who see it as a very safe bet.
On the other hand, you might look at an older, Class B property in a city with slower growth and decide you need a 7.5% cap rate to make the higher risk worthwhile. The key takeaway is to never, ever look at a cap rate in a vacuum. You have to benchmark it against what similar properties have actually sold for in that specific neighborhood recently.
How Do Interest Rates Play into This?
Interest rates and cap rates are connected, though they don't always move in perfect lockstep. Think of them as dance partners—one usually leads, and the other follows after a bit of a delay.
When interest rates go up, so does the cost of getting a loan. This immediately cools off the buyer pool because fewer people can afford the debt. To get a deal done and still make a decent return on top of their expensive mortgage, investors start demanding higher yields. That pressure from buyers is what pushes cap rates upward.
The reverse is also true. When rates fall, financing gets cheaper, which brings more buyers to the table. More competition bids up property prices, and as a result, cap rates get squeezed lower (or "compress," as we say in the industry).
Can I Use a Cap Rate for My Single-Family Rental?
Technically, you can run the numbers, but it’s not really the right tool for the job. The value of a single-family home is almost entirely driven by what similar houses are selling for nearby—the classic "comps" approach. Most of those comps are bought by people who plan to live in them, not rent them out, so income potential isn't the main pricing factor. For a rental home investor, calculating the cap rate is a perfectly fine way to gauge your own potential return. Just know that it’s not how the rest of the market is pricing that asset.
What’s the Difference Between Cap Rate and ROI?
Novice Lens (Key Definitions)
This is a really important one. Getting this right is critical.
A cap rate is the property's unleveraged annual return. It’s a pure measure of the asset's income-generating power relative to its total value, completely independent of any loans. You use it to compare one property directly against another.
Return on Investment (ROI), and more specifically your Cash-on-Cash Return, is a personal metric. It’s all about your deal and your financing. It measures the annual cash you get back before taxes against the actual cash you pulled out of your pocket (the down payment plus all your closing costs).
A property might be trading at a 6% cap rate, but if an investor uses smart financing, their actual cash-on-cash return could easily be 10% or even higher. The cap rate tells you about the property; the ROI tells you about your investment.
At Stiltsville Capital, our disciplined underwriting process goes far beyond simple metrics to identify opportunities with compelling risk-adjusted returns. Well-structured real assets can be a prudent, resilient component of a long-term wealth strategy. If you are an accredited investor interested in learning about our investment philosophy and current offerings in high-growth markets, we invite you to take the next step.
Information presented is for educational purposes only and does not constitute an offer to sell or a solicitation of an offer to buy securities. Any offering is made only through definitive offering documents (e.g., private placement memorandum, subscription agreement) and is available solely to investors who meet applicable suitability standards, including “Accredited Investor” status under Rule 501 of Regulation D. Investments in private real estate involve risk, including loss of capital, illiquidity, and no guarantee of distributions. Past performance is not indicative of future results.