What Is The Cap Rate? A Clear Guide for Real Estate Investors
- Ryan McDowell

- Dec 6, 2025
- 11 min read
Reading Time: 8 min | Good for: Novice Investors (A), Informed Principals (B)
TL;DR: What You Need to Know
What it is: The capitalization rate (cap rate) is a fundamental metric in real estate, measuring a property's potential annual return on an all-cash purchase. Think of it as the dividend yield for a building.
How it works: Calculated as Net Operating Income (NOI) / Property Value, the cap rate shows the raw, unleveraged relationship between the income a property produces and its market price.
Why it matters: It provides a common yardstick to quickly compare different investment opportunities and gauge relative risk. A lower cap rate typically signals lower risk and higher value, while a higher cap rate suggests higher potential returns but often with greater risk.
The Investor Angle: Sophisticated investors don't just analyze cap rates; they actively work to compress them. The core of a value-add strategy is buying at a higher cap rate (lower value) and selling at a lower cap rate (higher value) after increasing the property's income.
The Market Why-Now: A Shifting Landscape
For investors allocating capital, understanding cap rate dynamics is more critical than ever. After a prolonged period of historically low interest rates that compressed cap rates to record lows, the market has entered a new phase. According to recent data from CBRE (as of Q1 2024), cap rates have expanded across most major asset classes over the past 18 months in response to tighter monetary policy. This shift creates both challenges and distinct opportunities for discerning investors who can identify mispriced assets and execute on value-add business plans.
Understanding The Cap Rate: A Simple Analogy
For investors new to commercial real estate, "cap rate" can sound like insider jargon. But it's one of the most fundamental tools for comparing investment opportunities, allowing a quick assessment of a property’s performance without getting bogged down by financing details.
The easiest way to think about it is to draw a parallel to the stock market. The cap rate is to real estate what the dividend yield is to a stock. A dividend yield tells you the annual cash payout as a percentage of the stock’s price. A cap rate does the exact same thing for a property—it shows the building's annual net income as a percentage of its current value.
Why It Matters for Novice Investors: The cap rate gives you a simple, standardized way to compare the raw profitability of a Miami high-rise versus a Tampa warehouse, regardless of how they are financed. It levels the playing field for an initial comparison.
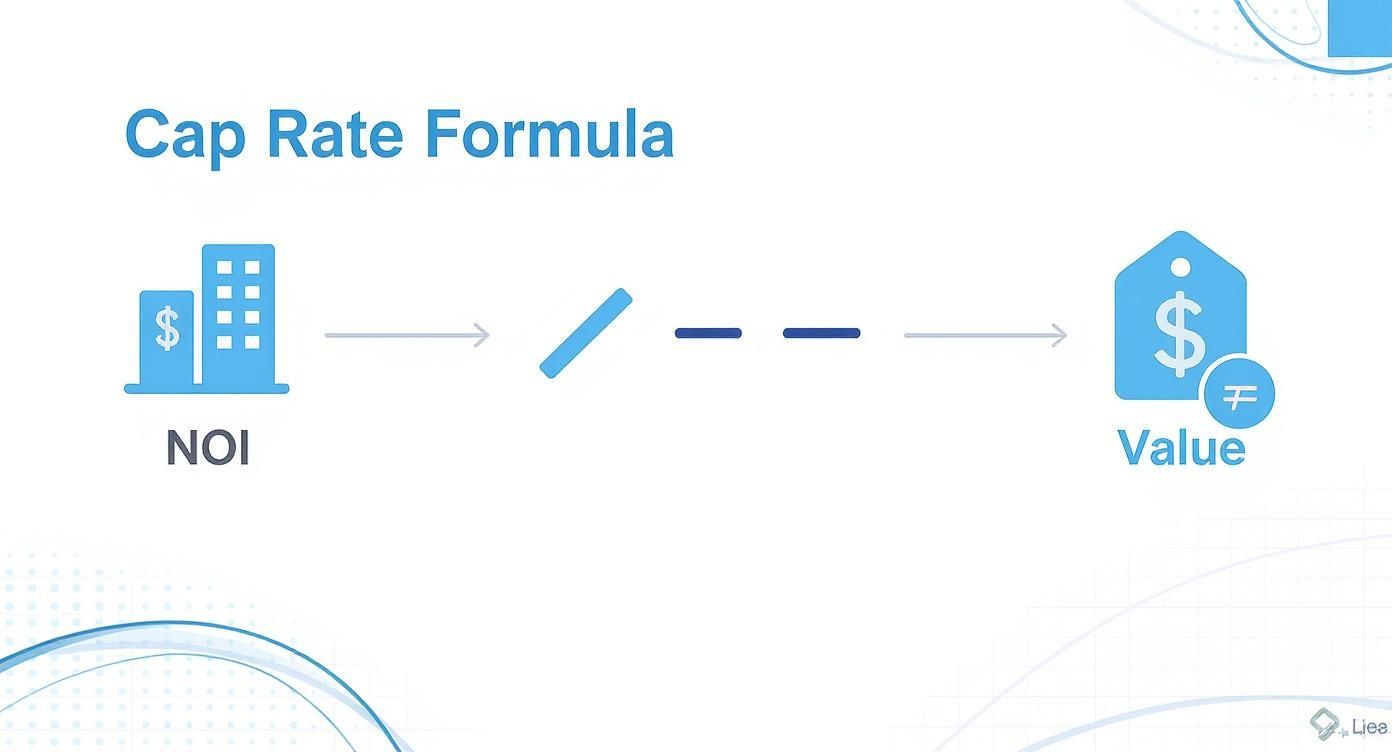
The Core Formula
The math behind it is refreshingly straightforward:
Cap Rate = Net Operating Income (NOI) / Property Value
Let’s quickly unpack those two pieces:
Net Operating Income (NOI): This is the total income a property generates (from rent and other sources) after you’ve paid all necessary operating expenses. This includes property taxes, insurance, maintenance, and management fees. Critically, NOI excludes mortgage payments, major capital repairs, and income taxes. It’s the pure, unlevered income from the asset itself.
Property Value: This is simply what the property is worth on the market today—or the price you’d pay to buy it.
When you divide the annual income by the price, you get a percentage representing the raw, unlevered return.
Typically, you'll see cap rates for commercial properties fall somewhere between 4% to 10%. As a rule of thumb, higher cap rates can signal bigger potential returns, but they often come with more risk. You can get a deeper look into commercial real estate cap rates to build on this concept.
What the Number Tells You
That final percentage is a powerful signal of risk and reward. A higher cap rate often points to a higher potential first-year return, but it might also be a red flag about perceived risk. On the flip side, a lower cap rate usually indicates a more stable, lower-risk asset—think a building with a long-term lease to a Fortune 500 company—which commands a higher price and therefore a lower initial yield.
How To Calculate The Cap Rate: A Practical Example
Knowing the formula is one thing; applying it to a live deal is where smart investing begins. It’s how we cut through the noise to see a property's true earning power.
Let's walk through an illustrative example using a 100-unit multifamily property, a core focus for Stiltsville Capital. Our first goal is to determine the Net Operating Income (NOI).
Step 1: Start With Gross Potential Rent
First, we calculate the maximum possible income if every unit were rented at market rate for the entire year.
100 units x $1,500/month average rent = $150,000 per month
$150,000/month x 12 months = $1,800,000 (Gross Potential Rent)
Step 2: Find The Effective Gross Income
Now, we adjust for reality. We must account for vacancy (empty units) and credit loss (tenants who don't pay). Assuming a 5% loss rate, which is standard for a stabilized property:
$1,800,000 (Gross Potential Rent) x 5% = $90,000 (Vacancy & Credit Loss)
$1,800,000 - $90,000 = $1,710,000 (Effective Gross Income)
This is a much more realistic picture of the cash collected.
Step 3: Calculate Net Operating Income
Next, we subtract all the operating expenses required to run the property. To get an accurate cap rate, you must first master the property's Net Operating Income, a figure closely tied to its operating cash flow.
Common operating expenses include:
Property Taxes: $200,000
Insurance: $100,000
Property Management (4% of EGI): $68,400
Repairs & Maintenance: $75,000
Utilities (common areas): $40,000
General & Administrative: $25,000
Total Operating Expenses: $508,400
For a deeper dive, our guide on how to find Net Operating Income breaks this down even further.
$1,710,000 (EGI) - $508,400 (Operating Expenses) = $1,201,600 (Net Operating Income)
This is the golden number. The NOI represents the property's annual profit before factoring in any loan payments or income taxes.
Illustrative NOI and Cap Rate Calculation for a 100-Unit Multifamily Property
Metric | Calculation/Notes | Amount |
|---|---|---|
Gross Potential Rent (GPR) | 100 units x $1,500/mo x 12 months | $1,800,000 |
Vacancy & Credit Loss | 5% of GPR | ($90,000) |
Effective Gross Income (EGI) | GPR - Vacancy & Credit Loss | $1,710,000 |
Total Operating Expenses | Sum of all property-level costs | ($508,400) |
Net Operating Income (NOI) | EGI - Total Operating Expenses | $1,201,600 |
Property Value (Purchase Price) | Assumed market price | $20,000,000 |
Cap Rate | NOI / Property Value | 6.01% |
This step-by-step flow shows exactly how we arrive at the final cap rate.
Step 4: Apply The Cap Rate Formula
With our NOI and an assumed purchase price of $20,000,000, the final step is simple.
Cap Rate = $1,201,600 (NOI) / $20,000,000 (Value)
Cap Rate = 6.01%
This means an all-cash purchase of this property would yield a 6.01% return in the first year before considering debt.
Trailing vs. Pro-Forma Cap Rates
One final, critical distinction: you must always ask which numbers are being used.
Trailing Cap Rate: Calculated using historical data, usually the last 12 months of performance (the "T12"). It tells you what the property has done. It's fact-based.
Pro-Forma Cap Rate: Uses projected future income and expenses. This is what you'll see in a value-add business plan, showing what the property could do after renovations and rent increases.
As an investor, you must scrutinize the assumptions behind any pro-forma cap rate. At Stiltsville Capital, we anchor our analysis in trailing numbers to establish a baseline of proven performance before modeling future potential.
What A Good Cap Rate Really Looks Like
So, what’s the magic number? The honest answer is… there isn’t one. A great cap rate for one investor might be an easy pass for another. It all comes down to context, risk appetite, and investment strategy.
A common mistake is chasing the highest cap rate. While a high cap rate signals stronger initial cash flow relative to the price, it almost always comes with a story—perhaps a challenged location, a building needing significant work, or unstable tenancy.
Conversely, a low cap rate isn't automatically "bad." It usually signals quality, stability, and high demand. A brand-new apartment building in a prime downtown location will have investors lining up, pushing the price up and, consequently, the cap rate down.
The See-Saw Relationship Between Cap Rates and Value
If there’s one thing to remember, it’s the inverse relationship between cap rates and property values. They move in opposite directions.
When cap rates go down (compress): Property values go up. This happens when a market gets hotter, interest rates fall, or an asset becomes more desirable.
When cap rates go up (expand): Property values go down. This can be triggered by rising interest rates, economic uncertainty, or property-specific issues.
This push and pull is a fundamental pattern in real estate cycles.
Market Signal Box: A Snapshot of Today's Cap Rate Ranges
To give you a real-world baseline, here’s a look at typical cap rate ranges for different commercial property types in major U.S. markets.
Investor Take: As of late 2024, the market continues to adjust to a higher interest rate environment. This has caused cap rates to expand across the board from the historic lows of 2021. According to JLL's Q2 2024 outlook, we see the following approximate ranges:* Multifamily: 5.0% - 6.0%. Sunbelt markets continue to show strength from job growth, though a wave of new supply has tempered rent growth in some submarkets.* Industrial / Logistics: 4.5% - 5.5%. This sector remains a favorite, fueled by e-commerce and supply chain onshoring, keeping cap rates relatively tight.* Neighborhood Retail: 6.0% - 7.5%. Centers anchored by grocery stores or other essential services demonstrate resilience, but rates reflect a higher perceived risk compared to industrial or multifamily.
Knowing these benchmarks is a start, but the real diligence begins when you ask "why" a specific property's cap rate deviates from the market average. For more detail, check our guide on what constitutes a good cap rate for real estate investors.
Key Factors That Drive Cap Rates Up Or Down
Cap rates are living metrics that shift with a mix of macroeconomic forces and property-specific details. Understanding these drivers is crucial for anticipating market shifts and spotting true value. These forces cause cap rates to either compress (go down, pushing values up) or expand (go up, pushing values down).

Macroeconomic Drivers The Big Picture
These are broad market currents that affect all investments.
Interest Rates: This is the big one. When the cost of borrowing rises, investors demand higher returns to compensate, causing cap rates to expand. Conversely, lower interest rates make financing cheaper, boosting demand and compressing cap rates.
Capital Flows: When a flood of capital chases real estate deals, the competition drives prices higher and cap rates lower. When that capital retreats, the opposite occurs.
Economic Growth & Employment: A strong economy with robust job growth fuels demand for all types of real estate. This positive momentum and potential for rent growth lead to lower, more compressed cap rates.
Property-Level Drivers What Makes An Asset Unique
These factors are specific to the property and its immediate submarket. This is where a sponsor’s deep expertise becomes a critical advantage.
Asset Type & Class: A new industrial facility leased to a major e-commerce company will trade at a much lower cap rate than an aging suburban office building with high vacancy. The perceived stability of the sector is a massive driver.
Location: The old mantra holds true. A multifamily property in a booming Sunbelt city will command a premium price and a lower cap rate than a similar building in a market with a declining population.
Tenant Quality & Lease Term: A property with a 15-year lease to a credit-grade national tenant is seen as nearly as safe as a corporate bond, warranting a very low cap rate. A building with many small tenants on short-term leases carries more risk and will trade at a higher cap rate.
Factors Driving Cap Rate Movement
Factor | Impact on Cap Rate Compression (Lower Rates) | Impact on Cap Rate Expansion (Higher Rates) |
|---|---|---|
Interest Rates | Federal Reserve lowers rates, making debt cheaper. | Federal Reserve raises rates, making debt expensive. |
Economic Outlook | Strong GDP growth, low unemployment, high consumer confidence. | Recession fears, rising unemployment, low consumer confidence. |
Capital Flows | High investor demand, lots of available capital chasing deals. | Capital flight, tighter lending standards from banks. |
Asset Location | Prime urban core or a high-growth Sunbelt market. | Secondary or tertiary market with a declining population. |
Tenant Profile | Long-term leases with high-credit, investment-grade tenants. | Short-term leases with small, unrated, or local tenants. |
Asset Quality | New construction, Class A, with modern, in-demand amenities. | Older building, Class C, needs significant capital improvements. |
At Stiltsville Capital, we constantly analyze these trends—not just to value properties today, but to forecast how those values might change over the life of an investment.
Why Cap Rate Is Only Part of The Story
Relying on cap rate alone is like driving a car by only looking at the speedometer. It’s vital, but it tells you nothing about the road ahead. The cap rate is a snapshot in time that can be misleading in isolation.
Its biggest weakness is what it ignores: the impact of financing, the time value of money, future rent growth, and the profit from an eventual sale. A 6% cap rate might seem less attractive than an 8% cap rate, but if the 6% deal has a clear path to major NOI growth, it could easily be the superior long-term investment.
To build a complete view, sophisticated investors layer in complementary metrics.
Beyond the Snapshot: Complementary Metrics
Internal Rate of Return (IRR): If cap rate is a snapshot, IRR is the full-length movie. It calculates the total annualized return over the entire holding period, factoring in the initial investment, all income generated, and the final profit from the sale.
Cash-on-Cash Return: This metric brings leverage into the equation. It answers the question: "For every dollar I invest, how much cash do I get back each year?" It’s calculated as the annual pre-tax cash flow divided by the total cash invested.
Equity Multiple: This shows the total cash returned as a multiple of the original investment. A 2.0x equity multiple simply means you doubled your money. It’s a straightforward measure of total profit.
While cap rates offer a valuable snapshot, they are just one piece of the puzzle. To understand the full financial picture, you must delve deeper into how to calculate Return on Investment (ROI) for real estate.
Advanced Lens: Building the Financial ModelFor institutional investors and family offices, these metrics are interconnected components of a comprehensive financial model. We start with the going-in cap rate to establish a baseline. Then, we project future cash flows by modeling rent growth and operational improvements to forecast the IRR. By layering on specific debt assumptions, we can calculate the cash-on-cash return. Finally, we underwrite a conservative exit cap rate to determine the final sale price and the resulting equity multiple. This integrated approach is the only way to make a truly informed, risk-adjusted investment decision.
How We Use Cap Rates To Create Investor Value
At Stiltsville Capital, we don’t just analyze cap rates—we actively engineer them. Our value-add strategy boils down to a simple but powerful concept: buy at a high cap rate, sell at a low one.
This means we acquire properties that are underperforming—often with dated units, below-market rents, or inefficient management—at a relatively high cap rate. This higher initial yield reflects the property's current issues and perceived risk.
Engineering Cap Rate Compression
Once we acquire a property, our work begins. We execute a targeted business plan to systematically increase the Net Operating Income (NOI). This might involve modernizing apartments, adding in-demand amenities, or implementing better expense controls.
By forcing the NOI higher, we fundamentally change the property's financial profile. A higher NOI makes the property more valuable to the next buyer, which naturally leads to a lower, or "compressed," cap rate at the time of sale. The profit for our investors is driven by the spread we create between the high “going-in cap rate” we bought at and the lower "exit cap rate" we sell at. For a deeper dive, check out our guide on proven strategies to add value to real estate investments.
Investor Checklist: Questions to Ask a Sponsor About Cap Rate Assumptions
A sponsor’s cap rate assumptions are one of the most critical parts of any investment memorandum. Overly optimistic projections can make a mediocre deal look like a home run. As an investor, it is your job to pressure-test these numbers.
What is the going-in cap rate, and how does it compare to recent, comparable sales in the submarket?
What is your projected exit cap rate, and what market data supports that assumption?
How does your exit cap rate compare to the going-in cap rate? (A conservative model often assumes an exit cap rate slightly higher than the entry cap rate to build in a margin of safety.)
What are the specific, actionable steps you will take to grow the NOI?
What happens to my returns if the exit cap rate is 50 or 100 basis points higher than you've projected? (Stress-testing the model is non-negotiable.)
Take the Next Step
Understanding the cap rate is the first step toward building a resilient portfolio of real assets. As markets evolve, partnering with a sponsor who brings disciplined underwriting and a hands-on approach to value creation can be a significant advantage.
If you are an accredited investor interested in exploring passive institutional-quality real estate opportunities, we invite you to schedule a confidential call with our team.
Disclaimer: Information presented is for educational purposes only and does not constitute an offer to sell or a solicitation of an offer to buy securities. Any offering is made only through definitive offering documents (e.g., private placement memorandum, subscription agreement) and is available solely to investors who meet applicable suitability standards, including “Accredited Investor” status under Rule 501 of Regulation D. Investments in private real estate involve risk, including loss of capital, illiquidity, and no guarantee of distributions. Past performance is not indicative of future results.
Comments