top of page
Search

Reading Time: 8 min | Good for: Novice & Informed Investors (A, B)


TL;DR: Key Takeaways


  • Real estate offers unique tax advantages that significantly boost after-tax returns, making it a cornerstone of sophisticated wealth-building strategies.

  • Depreciation is the most powerful benefit, allowing you to deduct a property's value over time as a "phantom expense," shielding cash flow from taxes. Advanced strategies like cost segregation accelerate these deductions.

  • Mortgage interest is fully deductible on investment properties, turning leverage into a powerful tool for reducing taxable income.

  • 1031 exchanges are a game-changer, allowing you to defer capital gains and depreciation recapture taxes by rolling sale proceeds into a new property, compounding your wealth tax-free.

  • A sponsor's tax strategy is critical. Asking the right due diligence questions about cost segregation, 1031 exchanges, and leverage is non-negotiable.


Why This Matters for Your Portfolio Right Now


When you're evaluating a real estate deal, the purchase price and projected rental income are just the starting point. The real magic—and what separates a good investment from a truly great one—lies in the tax benefits. For savvy investors, from family offices to individuals building their first portfolio, a smart tax strategy isn't an afterthought; it's a foundational component of underwriting that can dramatically enhance real-world returns.


In an economic environment with persistent inflation, these tax advantages become even more critical. According to a recent outlook from Deloitte, 14% of real estate investors cite tax advantages as a primary driver for increasing their allocations. Depreciation and interest deductions help you fight back by lowering your current taxable income, protecting the real-world value of your cash flow. This tax efficiency is a key reason well-structured real estate is a resilient asset class for long-term wealth preservation.


ree


This guide will break down the foundational tax benefits that make real estate a cornerstone of intelligent wealth-building.


The Investor's Core Tax-Saving Toolkit


Whether you're acquiring your first rental property or allocating capital to an institutional-grade fund, there are three core mechanisms you must understand:


  • Depreciation: Think of this as a "phantom expense." The IRS lets you deduct a portion of your property's value from your taxable income each year, even though you aren't actually spending any cash. It's a direct way to shield your rental income.

  • Interest Deductions: The interest you pay on the mortgage for your investment property is almost always 100% deductible. This turns the cost of borrowing money into a powerful tax shield.

  • 1031 Exchanges: This is a game-changer for growing your portfolio. It allows you to sell a property and roll all the proceeds into a new, similar property without paying a dime in capital gains tax. It keeps your capital working for you, tax-deferred.


Investor Take: In a market where every basis point of return counts, a robust tax strategy is what transforms a passive investment into an active tool for building and protecting wealth. It is often the single biggest factor in a deal's long-term success.

Even homeowners can access tax benefits, such as the federal tax credit for solar panel installations, but the advantages for investment real estate operate on a completely different scale.


Depreciation: The Ultimate Real Estate Tax Shield


Of all the investment real estate tax benefits, depreciation is arguably the most powerful. It's often called a "phantom expense" because it’s a non-cash deduction the IRS allows you to take against your property's value. This directly shields your rental income from taxes, putting more cash in your pocket without costing you a single out-of-pocket dollar.


This isn’t just a minor perk; it’s a foundational concept that can turn a good real estate deal into a great one by dramatically boosting your after-tax returns.


ree


The Mechanics of Depreciation


Here’s how it works: the IRS assigns a "useful life" to real estate—the timeframe over which you can deduct its value. A key point here is that land itself cannot be depreciated; only the building and other improvements on it qualify.


The standard timelines are:


  • Residential Property: Depreciated over 27.5 years.

  • Commercial Property: Depreciated over 39 years.


This provides a predictable, long-term tax shield. However, sophisticated investors and sponsors use advanced strategies to supercharge these benefits.


Advanced Strategy: Cost Segregation Studies


For institutional-grade investments, a cost segregation study is a game-changer. Instead of treating the entire building as one asset depreciating over 27.5 or 39 years, this detailed engineering-based analysis breaks it down into individual components.


This allows a sponsor to identify parts of the property with much shorter useful lives, such as:


  • 5-Year Property: Carpeting, certain appliances, and specialty light fixtures.

  • 7-Year Property: Office furniture and equipment.

  • 15-Year Property: Land improvements like parking lots, sidewalks, and landscaping.


By reclassifying these components, you can accelerate depreciation deductions into the first few years of ownership, resulting in a massive increase in tax savings and healthier early-year cash flow.


Insight Edge: The Power of Front-LoadingA cost segregation study can shift 20% to 40% of a property's total depreciable basis from the standard long-term schedule into these shorter 5, 7, and 15-year buckets. This front-loading of deductions is a primary reason institutional-quality real estate can deliver such superior after-tax returns, especially for value-add and development projects.

Bonus Depreciation: The Accelerator


Bonus depreciation is like pouring gasoline on the fire. This powerful provision allows investors to immediately deduct a large percentage of the cost of eligible property—generally anything with a useful life of 20 years or less—in the year it's placed in service.


While the 100% bonus depreciation from the Tax Cuts and Jobs Act of 2017 is phasing down, it remains an incredibly potent tool. For 2024, investors can still deduct 60% of the cost of qualifying assets upfront. When combined with a cost segregation study, the impact is enormous. For a deeper analysis, see our guide on The Tax Shield of Depreciation: an Investor's Guide to Boosting Returns.


More insights on market sentiment can be found in the latest commercial real estate trends from Deloitte.com.


Deal Lens Example: Illustrative Impact of Depreciation


Let's walk through a simplified example to see the difference this makes with a commercial property.


Assumptions:


  • Purchase Price: $10,000,000

  • Land Value (non-depreciable): $2,000,000

  • Building Value (depreciable basis): $8,000,000

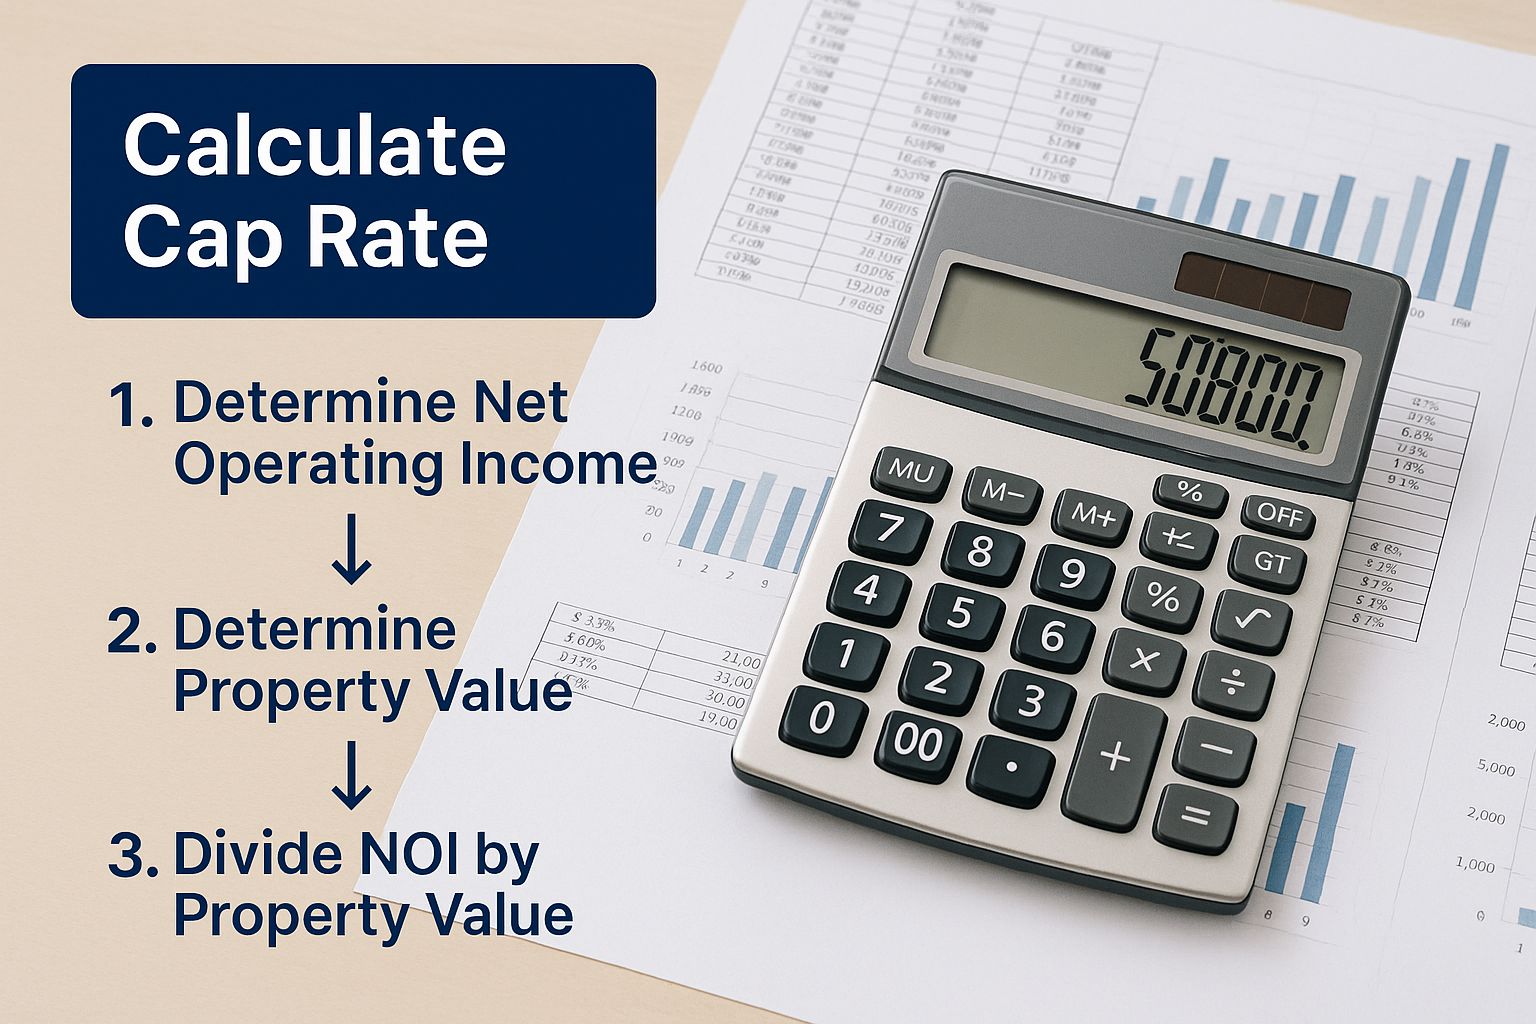
  • Net Operating Income (NOI): $500,000


Scenario 1: Standard Depreciation (39 Years)


  • Annual Depreciation Deduction: $8,000,000 / 39 years = $205,128

  • Taxable Income: $500,000 (NOI) - $205,128 (Depreciation) = $294,872


Scenario 2: With Cost Segregation


  • The study reclassifies 25% ($2,000,000) of the building's value into 5-year property.

  • First-Year Deduction (5-Year Property): $2,000,000 / 5 years = $400,000

  • Depreciation on Remainder (39 Years): $6,000,000 / 39 years = $153,846

  • Total Year 1 Deduction: $400,000 + $153,846 = $553,846

  • Taxable Income: $500,000 (NOI) - $553,846 (Depreciation) = -$53,846 (a passive loss)


In Scenario 2, the cost segregation study didn't just reduce the tax bill—it completely eliminated the property's taxable income for the year, creating a "paper loss" that can potentially offset other passive gains. This perfectly illustrates how a strategic approach to depreciation maximizes an investor's real, after-tax returns.


How Mortgage Interest Deductions Maximize Returns


After depreciation, the mortgage interest deduction is one of the most reliable and impactful tax benefits in an investor's playbook. It's what turns leverage—using borrowed capital to acquire a property—into a powerful tool for boosting after-tax returns.


The concept is simple: the interest you pay on a loan to acquire or improve an investment property is a business expense. That expense directly reduces your net operating income (NOI), which lowers your taxable income and, ultimately, your tax liability.


Unlike the mortgage interest deduction on a primary home, which is capped, the deduction for investment properties generally has no limit. This makes it a cornerstone of financial modeling for any serious real estate deal.


Understanding the Business Interest Limitation


For more sophisticated investors or those in larger partnerships, it's important to be aware of Internal Revenue Code Section 163(j). This rule can limit the amount of business interest expense you can deduct in a given year. Fortunately, most real estate businesses can elect out of this limitation, though it comes with a trade-off (typically longer depreciation schedules).


Novice Lens: Why This MattersThe key takeaway is that the money you pay the bank in interest on your investment property loan isn't just a cost—it's a tax deduction. This reduces your taxable profit, meaning you keep more of the cash your property generates.

The rules around interest deductibility are complex and can change, highlighting the importance of working with sponsors and tax professionals who stay on top of the latest regulations. This includes understanding the nuances of various financing structures, from traditional bank loans to government-backed options like FHA loan offerings.


A Practical Example of the Deduction's Impact


Let's break this down with some straightforward numbers to see it in action.


  • Property's Net Operating Income (NOI): $100,000

  • Annual Mortgage Interest Paid: $60,000


Without the deduction, your entire $100,000 in NOI would be subject to income tax (before other deductions like depreciation are factored in).


But by applying the mortgage interest deduction, you immediately shrink your taxable income:


  • Taxable Income: $100,000 (NOI) - $60,000 (Interest) = $40,000


Just like that, you've shielded $60,000 of your income from taxes. If you're in a 32% tax bracket, this single deduction translates to $19,200 in direct tax savings for the year. That's real cash that stays in the investment or goes right back into your pocket, proving that smart financing is directly tied to tax efficiency.


Using 1031 Exchanges to Defer Taxes and Build Wealth


Of all the tax benefits available to real estate investors, the Section 1031 “like-kind” exchange is one of the most powerful tools for building significant wealth. It allows you to defer paying capital gains taxes when you sell an investment property, provided you reinvest the proceeds into a new, similar ("like-kind") investment property.


Think of it as hitting the upgrade button on your portfolio. You can sell a small apartment building and funnel every dollar of profit into a larger, more valuable one—all without writing a check to the IRS. This keeps your capital working for you, compounding your growth in a tax-deferred environment.


The 1031 Exchange Process Unpacked


Successfully executing a 1031 exchange requires strict adherence to IRS timelines. The process itself is straightforward, but the deadlines are unforgiving.


This flow chart breaks down the essential steps and non-negotiable timelines.


ree


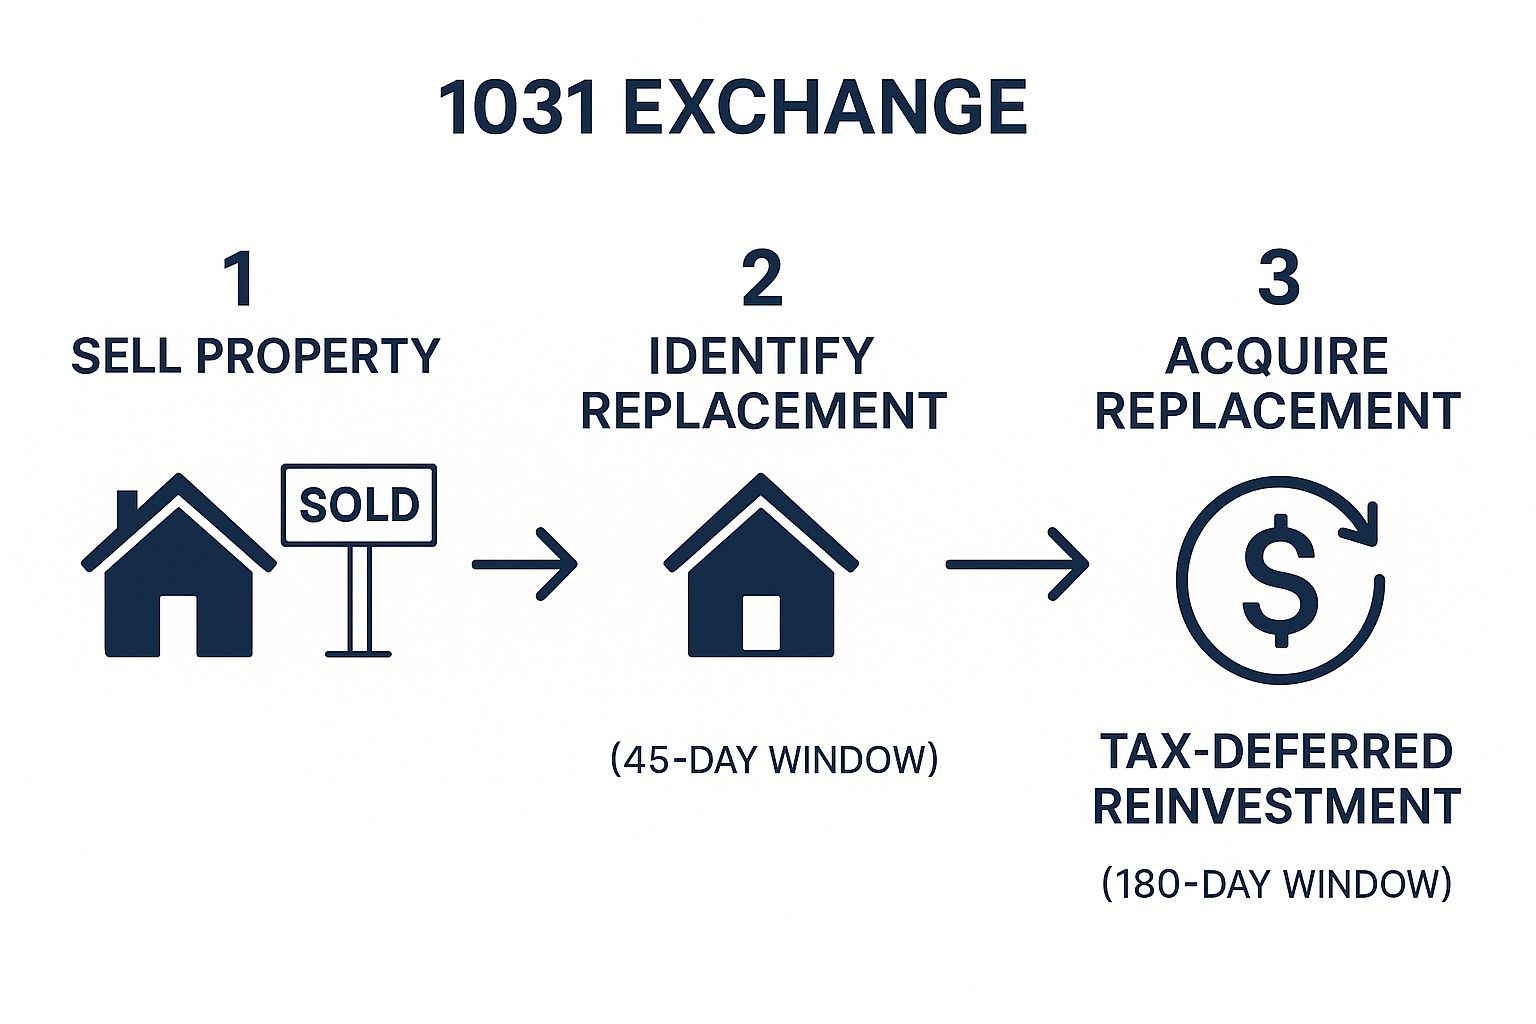
As you can see, the time windows are critical. Missing either the 45-day or 180-day deadline can disqualify the exchange, triggering the significant tax liability you sought to avoid.


Here’s the play-by-play:


  1. Sell Your Property: The proceeds from the sale go directly to a neutral third party called a Qualified Intermediary (QI). This is a crucial step—if you touch the money, the exchange is void.

  2. Identify the Replacement: You have exactly 45 days from the closing date to formally identify potential replacement properties in writing to your QI.

  3. Acquire the New Property: You must close on one or more of the identified properties within 180 days of selling your original one. That 180-day clock starts on the day you sell, not after the 45-day window closes.


To defer all taxes, the new property must be of equal or greater value, and you must reinvest all net proceeds.


Key Timelines and Rules for a 1031 Exchange


The deadlines for a 1031 exchange are strict and absolute. This table summarizes the critical milestones you cannot afford to miss.


Milestone

Deadline

Key Requirement

Identification Period

45 Days from Sale

Formally identify potential replacement properties in writing to your Qualified Intermediary.

Exchange Period

180 Days from Sale

Close on the acquisition of the identified replacement property.

Value Requirement

At Closing

The new property's value must be equal to or greater than the one you sold.

Equity Requirement

At Closing

All net proceeds from the sale must be reinvested into the new property.

Debt Requirement

At Closing

The debt on the new property must be equal to or greater than the debt on the old one.


Adhering to these rules is non-negotiable for a successful tax-deferred exchange. Working with an experienced QI is essential.


Strategic Applications for Sophisticated Investors


While the basics are powerful, seasoned investors and family offices use 1031 exchanges for much more than just tax deferral. It’s about strategically repositioning an entire portfolio.


  • Consolidation: Exchange several smaller, high-maintenance properties for a single, institutional-grade asset like a large multifamily complex to simplify management and achieve economies of scale.

  • Diversification: Trade a single property in one city for multiple properties across different geographic markets to spread risk without triggering a taxable event.

  • Transition to Passive Investing: An active owner of a retail center can exchange it for a passive interest in a professionally managed real estate fund or syndication. This keeps their capital deployed while eliminating day-to-day operational responsibilities.


For a deeper dive, explore our guide on how to do a 1031 exchange.


Comparing Tax-Advantaged Investment Structures


How you hold your real estate is as important as what you hold. The investment structure you choose directly impacts how tax benefits flow to you.


For most passive investors, the choice often comes down to two primary paths: direct ownership through a syndication—typically structured as an LLC or Limited Partnership (LP)—and investing in a Real Estate Investment Trust (REIT). Each offers a unique set of tax advantages.


ree


The Syndication Model: The Power of Pass-Through


When you invest in a private real estate syndication, you become a direct partner in the entity that owns the asset. This "pass-through" structure means the partnership itself pays no corporate income tax.


Instead, all financial results—income, expenses, and powerful depreciation deductions—flow directly to you and the other investors. Each year, you receive a Schedule K-1 detailing your share of the profits and losses.


Why it matters: The primary advantage here is receiving the full benefit of depreciation on your personal tax return. This "paper loss" often shelters the cash distributions you receive, making them tax-deferred or even tax-free, especially in the early years of an investment.

This direct pass-through of losses can be used to offset passive gains from other investments, giving you significant control over your tax planning. For a deeper look at these structures, see our guide to private equity real estate fund structures.


The REIT Model: Dividends and the QBI Deduction


REITs offer a liquid, publicly-traded way to invest in a diverse portfolio of properties. Their tax magic happens at the corporate level. To maintain their tax-advantaged status, REITs must distribute at least 90% of their taxable income to shareholders as dividends.


By doing so, the REIT itself avoids corporate income tax on that distributed income. For investors, these dividends often qualify for the Section 199A qualified business income (QBI) deduction, which allows shareholders to deduct 20% of their ordinary dividend income. This effectively lowers the top federal tax rate on those dividends from 37% to 29.6%.


Tax Benefit Comparison: Syndication vs. REITs


The choice between a syndication and a REIT depends on your goals for tax efficiency, liquidity, and control.


Feature

Direct Syndication (via LLC/LP)

REIT (Real Estate Investment Trust)

Tax Reporting

Schedule K-1

Form 1099-DIV

Depreciation

Passed directly to investors to offset passive income.

Handled at the corporate level; investors do not directly claim depreciation.

Primary Tax Benefit

Direct use of depreciation to create tax-deferred or tax-free cash flow.

Section 199A QBI deduction allows a 20% deduction on ordinary dividend income.

Liquidity

Highly illiquid; capital is typically locked in for 3-7 years.

Highly liquid for publicly traded REITs; shares can be sold daily.

Investor Control

Minimal direct control, but high transparency and alignment with a specific sponsor and property.

No control over individual properties; you're invested in a diversified portfolio.


Ultimately, syndications offer a more direct, hands-on approach to tax management with the powerful benefit of depreciation pass-through. REITs provide simplicity, liquidity, and a straightforward tax deduction on dividends.


Checklist: Questions to Ask a Sponsor About Their Tax Strategy


Knowing the theory behind tax benefits is one thing; ensuring your sponsor is actively working to maximize them is another. A disciplined sponsor integrates a sophisticated tax strategy into the business plan from day one. Asking these questions during your due diligence is critical.


Foundational Tax Strategy Inquiries


  • Do you plan to conduct a cost segregation study on this asset? * Why it matters: An immediate "yes" is a strong indicator of sophistication. As discussed, cost segregation accelerates depreciation, providing a significant tax-deferred boost to cash flow in the early years. A "no" requires a very compelling justification.

  • How will depreciation recapture be managed at the sale of the property? * Why it matters: This question tests foresight. The gold-standard answer is a clear plan to execute a 1031 exchange, deferring both recapture and capital gains taxes to allow capital to continue compounding.


Advanced and Structural Questions


  • What is your philosophy on leverage, and how does that inform the interest deduction strategy? * Why it matters: You want a sponsor who uses debt strategically to enhance returns via the interest deduction, but without taking on excessive risk. Their answer should reflect a balanced, disciplined approach that matches the asset's business plan.

  • Will investors receive a Schedule K-1, and what is your typical timeline for delivery? * Why it matters: For a direct syndication, the Schedule K-1 is the document that passes tax benefits to you. A sponsor should confirm they issue K-1s and have a reliable timeline for delivery. Consistently late K-1s can disrupt your personal tax filing and may signal back-office inefficiencies.


A confident, transparent sponsor will welcome these questions and provide clear, detailed answers. It’s the best way to confirm their commitment to maximizing every angle of your investment.


Frequently Asked Questions


What is depreciation recapture and how does it affect me?


Depreciation is a tax benefit you receive while holding a property. When you sell that property for a profit, the IRS "recaptures" the benefit you received. The portion of your gain attributable to depreciation deductions is taxed at a special rate of up to 25%, which can be higher than the standard long-term capital gains rate. The primary strategy to defer this tax is to use a 1031 exchange, rolling the proceeds into a new property.


Can I use real estate losses to offset my W-2 job income?


For most investors, the answer is no. Rental income is generally considered "passive" by the IRS. Passive losses can typically only offset passive gains (e.g., from other rental properties). You generally cannot use them to reduce taxable income from an active source like a salary. However, these passive losses are not lost; they are carried forward and can be used to offset future passive gains or can be fully deducted when the property is sold.


Are property taxes on an investment property deductible?


Yes, absolutely. For an investment property, state and local property taxes are 100% deductible as a business expense. This is a significant advantage over a personal residence, where the state and local tax (SALT) deduction is currently capped at $10,000 per household. Investment properties are not subject to this cap, making property taxes a powerful and reliable annual deduction.


At Stiltsville Capital, a sophisticated tax strategy isn't an afterthought—it's engineered into every investment from day one. To learn how our disciplined, institutional-grade approach can enhance your portfolio's after-tax returns, schedule a confidential call with our team.


Information presented is for educational purposes only and does not constitute an offer to sell or a solicitation of an offer to buy securities. Any offering is made only through definitive offering documents (e.g., private placement memorandum, subscription agreement) and is available solely to investors who meet applicable suitability standards, including “Accredited Investor” status under Rule 501 of Regulation D. Investments in private real estate involve risk, including loss of capital, illiquidity, and no guarantee of distributions. Past performance is not indicative of future results.


Reading Time: 7 min | Good for: Novice (A), Informed (B)


TL;DR: Key Takeaways on Calculating Cap Rate


  • The Formula: Cap Rate = Net Operating Income (NOI) / Property Market Value. It's the unlevered annual return on an asset.

  • Why It Matters: The cap rate is the great equalizer in real estate, allowing you to compare the raw earning power of different properties, regardless of financing.

  • NOI is Everything: Your cap rate is only as good as your Net Operating Income calculation. Underwrite your own numbers; never trust a seller's pro-forma at face value.

  • Context is King: A "good" cap rate is relative. It depends entirely on the property type, location, asset condition, and the broader economic environment. A 5% cap rate might be a great deal for a Class A industrial asset but a terrible one for an aging office building.

  • Investor Action: Use the cap rate formula in reverse (Market Value = NOI / Target Cap Rate) to determine your maximum offer price and maintain investment discipline.


The Market Why-Now: Cap Rates in a Shifting Landscape


For sophisticated investors and family offices, understanding how to figure the cap rate has never been more critical. In today's dynamic market, the spread between asset classes tells a compelling story. As of early 2024, the U.S. office sector saw its average cap rate climb towards 7.4%, reflecting ongoing uncertainty. In stark contrast, multifamily and industrial properties continued to trade at much tighter (lower) cap rates, prized for their perceived stability and strong rental growth prospects, according to analysis from CBRE. This divergence highlights that a disciplined, property-level underwriting process is paramount for identifying value and avoiding mispriced risk.


What a Cap Rate Really Tells You


ree


Before you open a spreadsheet, you need to grasp what a cap rate represents. Think of it as the great equalizer in commercial real estate. It cuts through the noise of financing and complex debt structures to show you the raw, operational earning power of an asset.


This is what allows you to make clean, apples-to-apples comparisons. Suddenly, a small multifamily building in Austin can be benchmarked against a sprawling retail center in Miami using one powerful number. Getting this right is the foundation for making disciplined, data-driven investment decisions.


The Core Formula Explained


The capitalization rate formula is beautiful in its simplicity:


Cap Rate = Net Operating Income (NOI) / Property Market Value


Let's put it into practice. A property bringing in $100,000 in NOI that’s valued at $2,000,000 would have a 5% cap rate. ($100,000 / $2,000,000).


Novice Lens: What is NOI?What exactly is Net Operating Income? It’s all the revenue a property generates (from rent, fees, etc.) minus all of its day-to-day operating expenses. The key here is what it excludes: mortgage payments, major capital improvements, and income taxes. This gives you the purest view of a property's operational health and is the true engine of your return.

Why This Metric Matters for Investors


For a real estate investor, the cap rate is more than just a number—it’s a barometer for risk, value, and overall market sentiment. Understanding its nuances separates savvy investors who spot a great deal from those who overpay.


To get comfortable with the inputs, here's a quick breakdown of what goes into the formula.


Cap Rate Formula Components at a Glance


Component

What It Is

Why It Matters for Your Analysis

Net Operating Income (NOI)

The property's total income minus its operating expenses.

This is the engine of your return. A higher, stable NOI signals a healthier, more profitable asset.

Property Market Value

The current price the property would likely sell for on the open market.

This is your denominator—the "cost" of the investment. It reflects market demand, location, and asset condition.


Understanding these two components is your first step toward using the cap rate effectively in your deal analysis. For investors who want to go deeper, a great resource is this guide on analyzing real estate investment deals.


Calculating Your Net Operating Income Accurately


A rock-solid cap rate hinges on an equally solid Net Operating Income (NOI). This number is the absolute engine of your investment analysis, and frankly, getting it right is what separates disciplined investors from those just taking a flyer on optimistic projections. The process starts with a property’s total potential income and then systematically strips away the realistic costs.


Here’s where many investors stumble: they accept the seller's pro-forma numbers at face value. Those documents are marketing, plain and simple. They often paint a rosy picture, downplaying expenses and assuming every unit is full. Real underwriting means you build your own NOI from scratch, using verifiable income and accounting for every operational cost.


From Gross Income to Realistic NOI


To get your cap rate right, you must start with the property's real-world income potential. Before you can even touch your NOI calculation, you have to calculate rental income accurately for the property. This first figure, the Gross Potential Income (GPI), is your starting line—and you'll immediately start adjusting it downward.


Your math must reflect real-world revenue drains, such as:


  • Vacancy Loss: No property stays 100% occupied forever. You have to deduct a realistic vacancy rate—say, 5-10% of GPI—based on the local market and the building's history.

  • Credit Loss: This covers the unfortunate reality of tenants who don't pay their rent. Budgeting even a small percentage for this keeps your numbers grounded in reality.


Once you subtract vacancy and credit loss from your GPI, you have your Effective Gross Income. From there, you subtract all the operating expenses—the day-to-day costs of keeping the lights on and the property running. These can't be ignored. For a complete deep dive, our team put together a detailed guide on how to find net operating income for your real estate investments.


Deal Lens: A Small Multifamily Property


Let's walk through a simplified case showing how a sponsor creates value. This highlights how quickly an optimistic projection can get derailed by realistic underwriting when you're figuring out the cap rate.


Assumptions (Illustrative):


  • Property: 10-unit apartment building.

  • Rent per Unit: $1,500/month.

  • Purchase Price: $1,800,000.


Income / Expense Line Item

Seller's Pro-Forma

Realistic Underwriting

Gross Potential Income

$180,000

$180,000

Vacancy & Credit Loss (5%)

$0

-$9,000

Effective Gross Income

$180,000

$171,000

Property Taxes

-$18,000

-$18,000

Insurance

-$6,000

-$6,000

Management Fee (8%)

-$9,000

-$13,680

Repairs & Maintenance

-$5,000

-$7,500

Capital Reserves

$0

-$5,000

Total Operating Expenses

-$38,000

-$50,180

Net Operating Income (NOI)

$142,000

$120,820


Based on these numbers, the seller might advertise a juicy 7.9% cap rate ($142,000 / $1.8M). But a more prudent calculation—one that actually accounts for vacancy and sets aside money for future big-ticket repairs—reveals the actual entry cap rate is closer to 6.7% ($120,820 / $1.8M). That 120-basis-point difference is a big deal, directly impacting your offer price and your return projections from day one.

Let's Run the Numbers: A Real-World Cap Rate Example


Theory is great, but putting it into practice is where the real value is. Let’s walk through a complete, real-world example of how to figure out the cap rate for a hypothetical 20-unit apartment building. This will show you exactly how the numbers flow, from the top-line rent all the way down to the final cap rate.


Think of it like a funnel. You start with the widest numbers (potential income) and gradually narrow them down to the precise figure you need.


ree


Gathering the Raw Data


First, we need to assemble our key data points for this 20-unit building.


  • Purchase Price: The seller is asking for $4,000,000.

  • Gross Potential Rent (GPR): Each unit pulls in $2,000/month. That gives us a GPR of $480,000 for the year (20 units x $2,000 x 12 months).

  • Vacancy Allowance: We are conservative here. Let’s budget for a 5% vacancy and credit loss, which comes out to $24,000. This gives us an Effective Gross Income (EGI) of $456,000.


With our income figured out, it's time to tally up the annual operating expenses to get to our Net Operating Income (NOI).


  • Property Taxes: $45,000

  • Insurance: $15,000

  • Utilities (for common areas): $12,000

  • Property Management (a standard 8% of EGI): $36,480

  • Repairs & Maintenance: $20,000

  • Reserves for Capital Expenditures: $10,000


Add it all up, and you get Total Operating Expenses of $138,480. When you subtract that from our EGI of $456,000, you're left with a Net Operating Income (NOI) of $317,520.


Now for the easy part. We just plug the NOI and purchase price into our formula:


$317,520 (NOI) / $4,000,000 (Price) = 7.94% Cap Rate

Flipping the Formula for Smarter Investing


Here's a pro tip: the most experienced investors use this formula in reverse. This is where it becomes a powerful underwriting tool.


Let's say you already know the property's NOI is $317,520, but your target entry cap rate for a deal like this is 8.5%. You can use that to calculate your maximum offer price.


$317,520 / 0.085 = $3,735,529


Suddenly, the cap rate isn't just a simple calculation—it's a strategic negotiation tool. It ensures you never overpay based on the return you require. This analytical rigor separates good investors from great ones.


While local markets can be volatile, national average cap rates have stayed remarkably consistent over time. This underscores how important it is to get your property-level underwriting right. For a deeper dive into these long-term trends, you can explore the connections of commercial property cap rates on cbre.com.


What Your Cap Rate Is Really Telling You


ree


Running the numbers is just the starting line. The real art is understanding what that final cap rate figure means for your investment. A cap rate is never just a number—it’s a powerful signal about a property’s risk, its value, and where it sits in the current market.


At its core, there’s an inverse relationship between cap rates and risk. A lower cap rate suggests a higher price tag and lower perceived risk. This is your brand-new, Class A apartment building in a hot downtown market, packed with long-term tenants. Investors will pay a premium for that stability, which compresses the cap rate.


On the flip side, a higher cap rate often points to higher perceived risk, but also a greater potential for upside. This could be an older, Class C building in a secondary market with a mix of short-term leases. The market demands a higher return to compensate for the added uncertainty.


Context Is Everything: Benchmarking Your Deal


A "good" cap rate doesn't exist in a vacuum. It’s completely dependent on the specifics of the deal. Disciplined investors benchmark their results against a few key factors:


  • Property Type: A multifamily building will trade at a totally different cap rate than a hotel or a self-storage facility.

  • Location Quality: A prime urban core (Class A) location will always command a lower cap rate than a suburban or tertiary (Class B/C) market.

  • Asset Condition: Are you buying a stabilized, cash-flowing property, or a value-add project that needs a serious capital injection?

  • Tenant Strength: There's a world of difference between a building leased to a Fortune 500 company on a 20-year term and one with a dozen small tenants on month-to-month agreements.


Insight Edge: Market Signal BoxIn late 2023, the U.S. office sector was seeing an average cap rate of 6.54%, and most analysts expected it to climb higher. Meanwhile, multifamily and industrial properties were trading at much lower cap rates due to their perceived stability and stronger growth prospects (Source: Statista).Investor Take: A 5% cap rate might be a fantastic deal for a new industrial warehouse near a major port, but it could be a terrible one for an aging suburban office building. You have to know the right benchmark for that specific asset class and market.

For a much deeper dive into this, check out our guide on what is a good cap rate for real estate investors.


Cap Rates in a Dynamic Market Environment


Knowing how to calculate a cap rate is a vital technical skill, but the number you get is just a snapshot in time. A static calculation misses the bigger picture.


In reality, cap rates are fluid metrics that move with the currents of the broader economy. For any serious investor, understanding how these rates are likely to shift is just as crucial as calculating them for a deal today.


A cap rate is essentially a direct reflection of investor sentiment and the cost of capital. When the market is buzzing with optimism and borrowing is cheap, investors are willing to pay more for future income streams. That competition pushes property prices up and, in turn, compresses cap rates.


But when uncertainty creeps in and interest rates start to climb, investors demand a higher risk premium for their capital. This naturally leads to cap rate expansion.


The Influence of Macroeconomic Forces


By far, the most significant outside force acting on cap rates is interest rates. The 10-year U.S. Treasury bond is the classic "risk-free" benchmark that all other investments are measured against. Commercial real estate simply has to offer a better return to compensate investors for taking on the risks of illiquidity, management headaches, and market swings.


Advanced Lens: The Cap Rate SpreadAs interest rates rise, so does the cost of debt needed to finance an acquisition. To hit their target returns, buyers have two choices: find a property with a higher Net Operating Income (NOI) or pay a lower price. If the property's income is stable, the only lever to pull is price—which directly translates to higher cap rates. The "spread" between a property's cap rate and the 10-year Treasury is a key indicator of perceived risk in real estate.

This isn't just theory; we see it play out in the data. Research from the CFA Institute has shown that a 100 basis point increase in mortgage debt growth relative to GDP can cause a 65 basis point jump in office cap rates. When credit conditions tightened after 2021, the market reacted just as you'd expect. You can learn more about the interplay between cap rates and interest rates on cfainstitute.org.


This forward-looking perspective is essential, especially when you are navigating the challenges confronting commercial real estate investors in today's environment. Understanding these market dynamics allows you to underwrite deals not just for today, but for where you believe the market is headed.


Actionable Investor Checklist: Questions to Ask a Sponsor


When evaluating a passive real estate opportunity, the cap rate is just the start. Use these questions to diligence a sponsor's assumptions:


  • What vacancy rate have you used in your pro-forma, and how does it compare to the submarket's historical average?

  • Can you provide a trailing 12-month (T-12) operating statement to validate your income and expense figures?

  • What are your assumptions for rental growth over the holding period?

  • What exit cap rate are you projecting, and what is your justification for that rate?

  • How have you accounted for deferred maintenance and future capital expenditures in your underwriting?

  • What property management fee is included, and is it in line with the market?

  • Are the property taxes based on the current assessment or reassessed at the purchase price?


Tying It All Together: From Calculation to Conviction


Mastering how to figure the cap rate is more than a mathematical exercise; it's about developing the discipline to look past the marketing and underwrite a deal based on its true operational and market fundamentals. For family offices and high-net-worth investors, this foundational skill is the first line of defense against overpaying and the first step toward identifying resilient, long-term value. When structured correctly within a diversified portfolio, high-quality real estate assets can provide a prudent, inflation-hedged component of a lasting wealth strategy.


At Stiltsville Capital, we believe that mastering foundational metrics is the key to identifying compelling investment opportunities. If you're an accredited investor interested in exploring institutional-quality real estate, we invite you to schedule a confidential call with our team.


Information presented is for educational purposes only and does not constitute an offer to sell or a solicitation of an offer to buy securities. Any offering is made only through definitive offering documents (e.g., private placement memorandum, subscription agreement) and is available solely to investors who meet applicable suitability standards, including “Accredited Investor” status under Rule 501 of Regulation D. Investments in private real estate involve risk, including loss of capital, illiquidity, and no guarantee of distributions. Past performance is not indicative of future results. Verification of accredited status is required for participation in Rule 506(c) offerings.


Reading Time: 8 min | Good for: A, B


TL;DR: Key Takeaways on IRR


  • What It Is: The Internal Rate of Return (IRR) is the true annualized return of an investment, accounting for the timing and size of all cash flows (both in and out).

  • Why It Matters: IRR allows investors to compare vastly different real estate projects—like a short-term multifamily renovation and a long-term data center development—on a true apples-to-apples basis.

  • How to Calculate It: Use the or, more accurately, the function in Excel or Google Sheets by listing all your cash outflows (negative) and inflows (positive) over time.

  • The Next Step: Once you have the IRR, you must compare it to a risk-appropriate "hurdle rate" and analyze the assumptions behind the number.


The Market Why-Now: Why Precision in Returns Matters


In today's capital markets, understanding the true return profile of an asset is more critical than ever. According to CBRE's 2024 U.S. Investor Intentions Survey, over 60% of investors expect to either maintain or increase their allocation to real estate. With more capital chasing deals, the ability to accurately underwrite and compare opportunities is what separates successful investors from the rest. The IRR is a foundational tool in this process, helping you see past simple profit multiples to understand the velocity of your capital and its true growth rate.


What Is IRR and Why It Matters for Investors


ree


The Internal Rate of Return (IRR) is arguably the single most important metric for sizing up the profitability of a real estate deal. In technical terms, it's the discount rate that makes the Net Present Value (NPV) of all cash flows equal to zero.


Novice Lens / Why It Matters:Think of IRR as the actual growth rate of your money. It answers the fundamental question, "What annual return am I getting on every dollar I have tied up in this project?" An investment that returns $100,000 in two years is a completely different animal from one that returns the same amount in five, and IRR is the tool that shows you precisely why. It’s the great equalizer, letting you compare a five-year apartment project against a ten-year data center development.

For sophisticated family offices and institutional players (Persona B/C), IRR plays a more technical role. It’s a core component of capital budgeting, used to vet potential deals against a pre-set hurdle rate—the absolute minimum return they’ll accept for an investment with a certain risk profile. If a project’s projected IRR can’t clear that hurdle, it’s a hard pass.


The Essential Inputs for an IRR Calculation


Whether you're using a back-of-the-napkin spreadsheet or sophisticated financial modeling software, every IRR calculation boils down to a few key inputs. Without these pieces, you're just guessing.


  • Initial Investment (Year 0): The total cash you put in upfront. This includes the purchase price, closing costs, and any day-one renovation funds. It's always a negative number (e.g., -$2,500,000).

  • Ongoing Cash Flows: The net cash generated by the property over the holding period (usually annually). This is your rental income minus all operating expenses (e.g., Year 1: $150,000, Year 2: $175,000).

  • Final Year Cash Flow (Exit Value): The big payday at the end. This is a combination of the final year's net operating income plus the net proceeds from selling the property (e.g., Year 5: $3,500,000).


Getting these three inputs right is the foundation of a reliable IRR calculation. The concept of IRR first popped up in the mid-20th century as modern finance took shape. Fast forward to today, and it’s a cornerstone of investment decisions across the globe. For instance, in stable, developed markets, an IRR above 10% is often considered a solid benchmark, as it aligns well with the historical average returns of other major asset classes.


Mapping Your Investment Cash Flows for an Accurate IRR


Before you can calculate anything, you need a precise map of every dollar that moves in and out of your investment. This cash flow timeline is the absolute bedrock of a reliable IRR calculation. Get this part wrong, and your final number will be misleading, no matter how fancy your spreadsheet is.


It all starts with that first transaction. This is your initial investment, a negative cash flow that happens at "Year 0." It represents the total capital you put into the deal—the purchase price, closing costs, and any upfront funds for renovations or improvements.


Charting the Project's Financial Journey


With the initial outlay recorded, the next step is to project the annual cash flows for the entire time you plan to hold the property. For most commercial real estate deals, this means forecasting the Net Operating Income (NOI). You’ll project rental income and then subtract all anticipated operating expenses and recurring capital improvements to land on the net cash flow for each year.


To really nail this, you need a solid grasp of how different financial activities play out. The pros often lean on their ability to read financial health through detailed reports, like in this guide to understanding cash flow statements. This foundational knowledge makes sure your projections are both comprehensive and realistic.


Investor Take: Every cash flow projection is built on assumptions about rent growth, vacancy rates, and expense inflation. A sharp sponsor will stress-test these assumptions, showing you how the IRR holds up in different market scenarios. This reveals the true risk profile of the deal far better than a single, optimistic number.

The simplified process below shows how to move from listing these cash flows to arriving at an actionable IRR.


ree


This visual really drives home the point that the calculation itself is just one piece of the puzzle. The quality of the cash flow data you feed into it is what truly determines the reliability of the final result.


Deal Lens: A Five-Year Multifamily Example


Let's make this real with a quick, illustrative example. Imagine we're looking at a five-year value-add multifamily project. The cash flow timeline might look something like this, with each entry representing the net cash moving to or from the investor.


Here's a simple layout you'd see in a spreadsheet:


  • Year 0 (Initial Investment): -$2,000,000

  • Year 1 (Stabilization): $120,000

  • Year 2 (Increased Rents): $150,000

  • Year 3 (Steady Operations): $160,000

  • Year 4 (Steady Operations): $165,000

  • Year 5 (Sale & Final Income): $3,000,000


Notice how the cash flows evolve. They reflect the value-add strategy—lower initial returns during renovation followed by higher, stabilized income. This dynamic modeling is far more precise than simple averaging and is a key concept related to the time value of money, which you can explore further in our guide to calculating a discounted cash flow for real estate.


The Critical Final Year Cash Flow


The most significant number on that list is often the cash flow in the final year. That isn't just the property's income for the year; it's a combination of the annual NOI plus the net proceeds from the sale. The sale proceeds are calculated by taking the projected sales price and subtracting the remaining loan balance and transaction costs, like brokerage fees.


An overly aggressive exit assumption can dramatically inflate a project's IRR, making a mediocre deal look fantastic. This is exactly why savvy investors spend so much time scrutinizing the exit cap rate and sales price assumptions. A small tweak to this single number can have an outsized impact on the entire return profile.


How to Calculate IRR Using Excel and Google Sheets


Once you have your cash flow timeline mapped out, you’re ready for the fun part: the actual calculation. Don't worry, you won’t need a fancy financial calculator or a math degree. The tools you already use every day—Microsoft Excel and Google Sheets—have everything you need to find the IRR quickly and accurately.


ree


Let's walk through how to do this using our multifamily project example from before. We'll focus on the two essential formulas you'll need: `IRR` and `XIRR`. Knowing when to use each one is the key to getting a result you can trust.


Using the Standard IRR Function


The standard function is your go-to for simple deals with evenly spaced cash flows. Think of a project that pays out exactly once a year, on the same date, without fail. It's clean, simple, and perfect for these straightforward scenarios.


To calculate it for our five-year project, you’d just list the cash flows in a single column in your spreadsheet:


  • Cell A1: -2,000,000 (Your initial investment)

  • Cell A2: 120,000 (Year 1)

  • Cell A3: 150,000 (Year 2)

  • Cell A4: 160,000 (Year 3)

  • Cell A5: 165,000 (Year 4)

  • Cell A6: 3,000,000 (Year 5, including the sale)


Then, in any blank cell, just type the formula: . Excel or Sheets will do the heavy lifting and spit out the answer, which in our case is 19.86%. This figure is the project's annualized return, but it's based on the assumption that every cash flow period is identical.


Novice Lens: The Most Common MistakeA frequent slip-up is entering the initial investment as a positive number. For the IRR formula to work, cash outflows (like your investment) must be negative, and inflows must be positive. If every number has the same sign, you’ll just get an error. Always double-check that your initial cash out is a negative value.

Why XIRR Is the Superior Tool for Real Estate


Here’s the thing about real estate: it's rarely that neat and tidy. Capital calls happen when they happen, you might close on a property in March, and then sell it in October five years down the line. Those irregular dates can throw off the standard IRR calculation, sometimes significantly.


This is exactly where the function becomes your best friend. It’s specifically built for cash flows that don't stick to a rigid schedule. The "X" in XIRR accounts for the exact timing of each cash flow, giving you a much more precise and realistic rate of return.


To use it, you'll need two columns: one for the cash, one for the dates.


Date (Column A)

Cash Flow (Column B)

01/15/2024

-2,000,000

12/31/2024

120,000

12/31/2025

150,000

12/31/2026

160,000

12/31/2027

165,000

10/31/2028

3,000,000


Your formula would look like this: . See how it needs two pieces of information? It pairs each cash flow amount with its corresponding date. This level of detail is why XIRR is the gold standard for accurately modeling real-world real estate deals.


Of course, if you'd rather skip the formulas, a dedicated real estate investment calculator can give you the IRR and other key metrics without having to build a spreadsheet from scratch.


Advanced Lens: The 'Guess' ArgumentIn rare cases with very unusual cash flows (like a large negative cash flow in the middle of a project), the IRR algorithm can sometimes struggle to solve the equation. The function has an optional "guess" argument, like . By giving it a starting point (e.g., 0.1 for 10%), you can nudge the function toward the correct answer. You'll almost never need this for a typical real estate project, but it’s a handy trick to have in your back pocket for complex modeling.

Interpreting Your IRR: What the Number Really Means


ree


Running the numbers in your spreadsheet to get an Internal Rate of Return is a crucial step, but it's really just the beginning. The real skill—the kind that separates amateur investors from seasoned pros—is knowing what that number actually says about a deal's potential and its underlying risks.


An 18% IRR might look great on paper, but context is everything. Is that 18% coming from a stable, cash-flowing apartment building or a speculative, ground-up development? The answer completely changes how you should view that return.


Benchmarking Against the Hurdle Rate


Your first reality check should always be the hurdle rate. Think of this as your minimum acceptable return for a project, considering its unique risk profile. It’s the bar that a deal’s projected IRR has to clear before it’s even worth a second look.


This rate isn’t one-size-fits-all; it changes based on the investment strategy.


  • Core Strategy: For a fully leased office building in a prime location with a credit-worthy tenant, the risk is low. Your hurdle rate might be in the 8% to 10% range.

  • Value-Add Strategy: Taking on a multifamily property that needs renovation and lease-up? That has more execution risk. Here, the hurdle rate climbs higher, maybe into the 12% to 15% range.

  • Opportunistic Strategy: A ground-up development with entitlement risk and zero cash flow from day one is the riskiest play. Investors will demand a much higher return, so the hurdle rate could easily be 20% or more.


Investor Take: A deal's IRR should never be evaluated in a vacuum. The first question should always be, "Does this return adequately compensate me for the risk I'm taking?" A 14% IRR on a core asset is fantastic. That same 14% IRR on an opportunistic deal is a clear sign to walk away.

Understanding the Reinvestment Assumption


The single biggest weakness of the IRR calculation is its built-in assumption about reinvestment. The formula quietly assumes that every dollar of cash flow you receive—those annual distributions—can be immediately reinvested at the exact same rate as the project's IRR.


So, if your project has a 20% IRR, the math pretends you can take every distribution check and find another investment that also generates a 20% return. In the real world, consistently finding those kinds of opportunities is next to impossible. This quirk often makes the IRR look a little more optimistic than reality. Because of this, savvy investors often bring in another metric to get a clearer picture.


The IRR and Equity Multiple Balancing Act


A high IRR can sometimes be misleading, particularly on short-term projects. You might hit a 25% IRR on a quick one-year flip, but the total profit you walk away with could be relatively small. On the other hand, a longer-term deal might show a lower IRR of 17% but generate a much larger pile of cash over its lifetime.


This is exactly why IRR should always be looked at alongside the Equity Multiple.


  • IRR tells you how fast your money is working.

  • Equity Multiple tells you how much money you get back in total.


For instance, an Equity Multiple of 2.0x means you’ve doubled your initial investment. A truly effective analysis uses both. The best deals deliver not just a strong IRR but also a healthy Equity Multiple. To really nail this concept, check out our detailed guide on the equity multiple formula in real estate.


Common IRR Mistakes and How to Avoid Them


A high IRR on paper means absolutely nothing without a rock-solid understanding of the assumptions propping it up. A rosy exit cap rate or an aggressive rent growth forecast can easily juice the IRR, making an average deal look like a grand slam. This is exactly why the due diligence process is so important.


Key Risks & Mitigations When Analyzing IRR


  • Risk: Overly Optimistic Assumptions * Mitigation: Insist on seeing the sponsor's sensitivity analysis. Ask how the IRR changes if rent growth is 1% lower or the exit cap rate is 50 basis points higher. A transparent sponsor will have this data ready.

  • Risk: Comparing Dissimilar Projects * Mitigation: Always evaluate IRR in the context of the deal's risk profile (Core, Value-Add, Opportunistic). A lower IRR on a safer asset is often a superior risk-adjusted return.

  • Risk: Ignoring Reinvestment Realities * Mitigation: Use the Equity Multiple as a complementary metric. This will show you the total wealth creation of a project, which is especially important for longer-hold investments where IRR can be less informative.


Investor Checklist: Questions to Ask a Sponsor


When a sponsor slides a pro forma across the table showing a juicy IRR, that’s not the end of the analysis—it’s the beginning of a conversation. Your job is to pressure-test their model and find its weak points.


  • "What are the core assumptions driving these cash flows? Specifically, where are you getting your numbers for rent growth, vacancy, and operating expense inflation?"

  • "How did you land on the exit cap rate? What are the historical cap rates for this type of asset in this specific submarket?"

  • "How much does the IRR change if the exit cap rate is a point higher, or if the sale is delayed by six months?"

  • "Are the capital expenditure budgets based on actual contractor bids, or are they estimates? Did you build in a contingency?"


Having a complete framework for vetting deals is non-negotiable. You can dive deeper with our guide on how to evaluate investment opportunities, which builds on these critical diligence steps.


Diving Deeper: Your IRR Questions Answered


What’s the Real Difference Between IRR and ROI?


Return on Investment (ROI) is a simple, static number. It tells you how much money you made as a percentage of what you put in, but it completely ignores how long it took to get it back. IRR, on the other hand, is all about time. It's a dynamic, annualized rate. Imagine two deals. One doubles your money in two years, and the other doubles your money in seven years. Both have the exact same 2.0x ROI. But the IRR on the two-year deal is drastically higher because it got your capital back to you faster.


Can IRR Be Negative? And What Does That Mean?


Absolutely. A negative IRR is an unmistakable sign that the investment lost money. It means the total cash you got back from the project was less than the total cash you put in. It's a clear signal that the deal failed to clear even a 0% return hurdle, resulting in a net loss of capital.


Why Would a Project Have Multiple IRRs?


This is a technical quirk that can happen in complex deals with non-standard cash flows (e.g., a large capital call in the middle of a project). If the cash flow stream flips from positive to negative more than once, it can create a situation where more than one discount rate can solve the IRR equation. In these rare cases, it's smart to lean on other metrics like Net Present Value (NPV) or Modified Internal Rate of Return (MIRR) to get a clearer picture.


How Does Debt Change the IRR Calculation?


Using debt—or leverage—can supercharge the IRR on your equity, but you have to calculate it the right way. You need to shift your focus from the property's overall returns to the specific returns on your equity stake. This is the "levered IRR." To find it, your cash flow timeline must track only the money that actually comes out of or goes into your pocket: your down payment, your cash flow after mortgage payments, and your final proceeds after the loan is paid off.


Well-structured real estate assets can be a prudent, resilient component of a long-term wealth strategy. At Stiltsville Capital, we believe a deep understanding of metrics like IRR is fundamental to making prudent investment decisions. Our disciplined approach ensures every opportunity is rigorously underwritten to identify its true potential and its fit within a diversified portfolio.


If you are an accredited investor looking to access institutional-grade real estate deals, we invite you to explore our approach.


Information presented is for educational purposes only and does not constitute an offer to sell or a solicitation of an offer to buy securities. Any offering is made only through definitive offering documents (e.g., private placement memorandum, subscription agreement) and is available solely to investors who meet applicable suitability standards, including “Accredited Investor” status under Rule 501 of Regulation D. Investments in private real estate involve risk, including loss of capital, illiquidity, and no guarantee of distributions. Past performance is not indicative of future results. Verification of accredited status is required for participation in Rule 506(c) offerings.


Corporate Office

30 West Mashta Drive | Suite 400

Key Biscayne, FL 33149​​

Tel: 786.316.9840

© 2025 Stiltsville Capital LLC

Stiltsville Capital LLC_logo_black

Disclosures

​​​Success Stories and Testimonials are intended to demonstrate our firms professional experience and history of providing exceptional service to their clients and reflect the collective experience of Stiltsville Capital, LLC's Principals and Team members and may include transactions/clients they have worked with directly at previous firms.

Stiltsville Capital, LLC and its affiliates do not provide tax or legal advice. Information contained on this website is provided for educational and illustrative purposes only and cannot be relied upon to avoid tax penalties. Please consult your tax and legal advisors to determine how this information may apply to your own situation. Whether any planned tax result is realized by you depends on the specific facts of your own situation at the time your tax return is filed. 


Real estate and private equity investments have special risks, including possible illiquidity of the underlying properties, credit risk, interest rate fluctuations, and the impact of varied economic conditions and may not be suitable for all investors.

bottom of page