- Ryan McDowell

- Dec 10, 2025
- 12 min read
Reading Time: 7 min | Good for: A, B
TL;DR: Key Investor Takeaways
What It Is: The depreciation tax shield is the total tax savings you get from your depreciation deduction. It's a "paper" expense for a property's wear and tear that reduces your taxable income without costing you any real cash.
Why It Matters: This non-cash deduction directly increases your after-tax cash flow, boosts your Internal Rate of Return (IRR), and helps you preserve capital by legally deferring taxes.
How It Works: Sophisticated sponsors use strategies like cost segregation studies and bonus depreciation to dramatically accelerate these deductions, creating massive tax savings in the early years of a deal.
Your Next Step: When evaluating a deal, ask sponsors specific questions about their depreciation strategy, including whether they use cost segregation and how they model for depreciation recapture upon sale.
Think of the depreciation tax shield as a powerful, built-in tax break for owning income-producing real estate. While your property is busy generating cash flow, the IRS lets you deduct a "paper" expense for the building's gradual wear and tear.
This non-cash expense is a game-changer. It reduces your taxable income without taking a single dollar out of your pocket, leading directly to a lower tax bill and more cash in your hand.
Why Depreciation Tax Shields Matter to You

Market Why-Now
The current economic environment, marked by fluctuating inflation and interest rates, places a premium on tax-efficient income. As of Q2 2024, high-net-worth investors continue to favor private real estate for its ability to generate tangible returns and significant tax advantages. According to a recent report by Knight Frank, nearly half of Ultra-High-Net-Worth Individuals (UHNWIs) plan to increase their allocation to commercial property, citing diversification and tax efficiency as key drivers. Depreciation remains one of the most reliable tools to enhance those returns.
For any serious investor in private real estate, getting a firm grip on depreciation isn't just a good idea—it's non-negotiable. It's hands-down one of the most significant advantages commercial real estate offers, with a direct line to your bottom line and the overall performance of an investment.
This concept is a true cornerstone of building long-term wealth. It lets smart capital allocators shield their profits and amplify their returns in a way few other asset classes can match.
Novice Lens: A depreciation tax shield is the total tax savings you get from your depreciation deduction. It's a 'paper loss' that creates real cash savings by lowering the amount of income the IRS can tax.
This powerful tool effectively lets you convert a slice of your property’s ordinary income, which can be taxed as high as 37%, into future long-term capital gains. Those are often taxed at a much friendlier 20% rate. It's a strategic reclassification of your returns.
The Core Benefits for Investors
At Stiltsville Capital, we see it in every deal: a well-executed depreciation strategy is what separates average returns from exceptional ones. For passive investors in our multifamily, data center, or hospitality offerings, the primary advantages really boil down to these three things:
Increased After-Tax Cash Flow: By shrinking your taxable income, depreciation puts more of the cash distributions you receive back into your pocket each year. This is the real, tangible benefit that hits your bank account.
Improved Internal Rate of Return (IRR): Tax savings, especially when accelerated into the early years of a deal, give your project's overall IRR a serious boost. Getting more cash back sooner makes any investment mathematically more profitable over its lifetime.
Capital Preservation: A lower annual tax burden lets more of your capital compound within the investment or your broader portfolio. It's a perfectly legal and strategic way to shelter investment gains from taxes.
To really put these benefits to work, you need to understand the nuts and bolts of an investment property depreciation schedule. In the next sections, we’ll break down exactly how the math works and dive into the advanced strategies we use to squeeze every last drop of value out of this benefit.
For a bird's-eye view, you can also explore our ultimate guide to real estate tax benefits for investors.
How The Depreciation Tax Shield Actually Works
Let's pull back the curtain on how this powerful financial tool actually works. At its core, the concept is refreshingly simple: depreciation is a non-cash expense. It lowers your taxable income on paper, but it doesn't actually take a single dollar out of your bank account. The tax savings you get from this "paper loss" is what we call the depreciation tax shield.
The math is direct and forms the foundation of this entire strategy. You can figure out your exact cash savings with a straightforward formula.

The Tax Shield Formula:Depreciation Expense x Your Marginal Tax Rate = Cash Saved
This paper deduction translates directly into real dollars that stay in your pocket instead of going to the IRS. For any commercial real estate investor, it’s a critical lever for pumping up after-tax returns.
The Formula In Action: A Clear Example
To see how this plays out in the real world, let's walk through a simplified example with a commercial property.
Imagine you're an investor in a partnership that owns a $5,000,000 commercial building. The IRS lets you depreciate the value of the building itself (but not the land it sits on) over a set number of years.
Building Value (Depreciable Basis): Let's say this is $3,900,000.
Depreciation Period (MACRS): For commercial property, this is 39 years.
Annual Depreciation Expense: $3,900,000 / 39 years = $100,000 per year.
Now, let's assume your personal marginal tax rate on this income is 35%. Plugging these numbers into our formula:
$100,000 (Depreciation Expense) x 0.35 (Tax Rate) = $35,000 (Annual Tax Savings)
That $35,000 is your depreciation tax shield for the year. It’s a direct cut in your tax bill, meaning your after-tax cash flow from the property is $35,000 higher than it would have been otherwise. You didn't spend any actual cash, but you saved a ton.
Why This Tax Break Even Exists
This powerful mechanism isn't some accidental loophole; it's a deliberate part of U.S. tax policy designed to get people to invest. The idea of depreciation tax shields really took hold after the Internal Revenue Code of 1954 was passed.
That landmark reform brought in accelerated depreciation methods, allowing businesses to claim bigger depreciation expenses in the early years of an asset's life. The government’s goal was simple: incentivize companies to spend more on equipment and buildings, which in turn would fire up the economy.
With today's corporate tax rate at 21%, a $100,000 depreciation deduction means a $21,000 tax reduction, year after year. This shield boosts a company's cash flow by lowering its taxable income, which frees up money for reinvestment or distributions. You can discover more insights about the depreciation tax shield on diversification.com.
By providing this tax benefit, the government encourages capital to flow into tangible assets—like the commercial properties we target at Stiltsville Capital. This creates jobs, improves infrastructure, and drives the economy forward, all while rewarding investors for putting their money to work.
Taking Your Tax Strategy to the Next Level
Once you’ve got a handle on the basics of depreciation, it’s time to move into the strategies that truly separate the pros from the amateurs. These are the tools sophisticated investors use to seriously accelerate their tax benefits and supercharge their returns.
The standard IRS playbook for real estate is the Modified Accelerated Cost Recovery System (MACRS). This is the government's official rulebook that sets the “useful life” for depreciating an asset. For real estate investors, two numbers are absolutely essential:
Residential Rental Property: Depreciated over 27.5 years.
Commercial Property: Depreciated over 39 years.
This conventional, straight-line approach gives you a steady and predictable depreciation expense each year. But let's be honest—it’s far from the most powerful way to generate tax shields.
The Game-Changer: Cost Segregation
This is where things get interesting. The real magic happens with cost segregation. Instead of treating your property as a single asset (the building), think of it as a collection of hundreds of different components. A cost segregation study is a detailed engineering analysis that does just that—it identifies and reclassifies parts of your property into much shorter depreciation schedules.
Imagine being able to pull out specific items like carpeting, specialty lighting, cabinetry, and even certain electrical and plumbing systems. Suddenly, you can depreciate them over 5, 7, or 15 years instead of the standard 27.5 or 39 years.
This strategy front-loads your depreciation deductions, creating massive tax shields in the crucial early years of an investment. It’s the difference between a slow trickle of tax savings and a powerful upfront wave that has a huge impact on your cash flow.
Pouring Gasoline on the Fire: Bonus Depreciation
To make cost segregation even more potent, Congress often allows for bonus depreciation. This rule, which changes over time, has historically let investors immediately deduct a huge percentage (sometimes up to 100%) of the cost of assets with a useful life of 20 years or less, all in the year they are placed in service.
When you combine a cost segregation study with bonus depreciation, the results are incredible. All those 5, 7, and 15-year assets you just identified can become eligible for this immediate, first-year write-off. This can generate enormous paper losses that wipe out income not just from the property itself, but potentially from other passive sources as well.
These advanced strategies are fundamental to modern real estate private equity. They directly boost cash flow, juice investor returns, and give you a significant competitive edge. For those looking to dig even deeper, this tax guide on deductions for real estate profits offers complementary insights that can round out your approach.
These methods also set you up perfectly for other powerful tax-deferral techniques. For instance, after maximizing your depreciation benefits, you can defer capital gains taxes on a sale by rolling the proceeds into a new deal. You can learn more about how that works in our practical guide on how to do a 1031 exchange. By stacking these strategies, you can build wealth far more efficiently over the long term.
Deal Lens: A Real-World Cost Segregation Example
Formulas and abstract concepts are one thing, but seeing the numbers play out in a real-world deal makes the power of a depreciation tax shield impossible to ignore. Let's walk through a practical case study to see just how dramatically a smart tax strategy can change an investment’s financial picture right from day one.
We'll look at a hypothetical acquisition of a multifamily property and compare two paths: the standard approach versus an accelerated one. You'll see how cost segregation creates a massive financial advantage.
Setting The Scene: A Multifamily Acquisition
Our scenario is a straightforward purchase of an apartment complex, a core asset for many sophisticated investors. The numbers are rounded for clarity but are right in line with a realistic institutional-grade deal.
Here are the key deal parameters:
Purchase Price: $10,000,000
Land Value (Non-Depreciable): $2,000,000
Improvement Value (Depreciable Basis): $8,000,000
Net Operating Income (NOI) in Year 1: $600,000
Investor's Marginal Tax Rate: 37%
With these figures, we can now model the outcomes under both a standard and an accelerated depreciation plan. This is where the real cash-flow difference pops.
Scenario A: The Standard Straight-Line Method
In our first scenario, the investor plays it by the book. Since the property is a residential rental, the IRS allows the entire $8,000,000 improvement value to be depreciated evenly over 27.5 years.
The math for the annual depreciation expense is simple:
Year 1 Depreciation: $8,000,000 / 27.5 years = $290,909
This deduction lowers the taxable income, creating a tax shield.
Year 1 Tax Shield: $290,909 (Depreciation) x 37% (Tax Rate) = $107,636 in tax savings.
After-Tax Cash Flow: $600,000 (NOI) - [($600,000 - $290,909) x 37%] = $486,364
That’s a solid, predictable outcome. But it leaves a ton of potential cash savings on the table, especially in the crucial early years when that capital is most valuable.
Scenario B: Unleashing Cost Segregation
Now, let's run the exact same deal but add a powerful strategic tool: a cost segregation study. This study identifies that 25% of the improvement value ($2,000,000) can be reclassified into shorter-life asset categories, like 5- and 15-year property. We’ll assume these components qualify for 80% bonus depreciation, a rate available in certain tax years.
Here’s how the Year 1 depreciation number explodes:
Bonus Depreciation: $2,000,000 x 80% = $1,600,000
Standard Depreciation (Remaining 75%): $6,000,000 / 27.5 years = $218,182
Total Year 1 Depreciation: $1,600,000 + $218,182 = $1,818,182
This massive paper loss generates an equally impressive tax shield.
Year 1 Tax Shield: $1,818,182 (Depreciation) x 37% (Tax Rate) = $672,727 in tax savings.
After-Tax Cash Flow: Because the paper loss is bigger than the income, the tax bill on the NOI is zero. The after-tax cash flow becomes the full $600,000, plus you have a massive loss to potentially offset other passive income.
Illustrative Example: Straight-Line vs. Cost Segregation ($10M Property)
To make the contrast crystal clear, let's put these two scenarios side-by-side. The difference in Year 1 is staggering.
Metric | Scenario A: Straight-Line | Scenario B: Cost Segregation |
|---|---|---|
Year 1 Depreciation | $290,909 | $1,818,182 |
Year 1 Taxable Income | $309,091 | -$1,218,182 |
Year 1 Tax Savings | $107,636 | $672,727 |
Year 1 After-Tax Cash | $486,364 | $600,000 |
Net Cash Benefit in Yr 1 | - | $565,091 |
By front-loading deductions, the investor in Scenario B frees up over half a million dollars in tax savings in the very first year. This isn't just a number on a spreadsheet; it's real capital that can be reinvested, returned to LPs, or used to de-risk the project.
The infographic below shows how these different strategies—standard MACRS, detailed Cost Segregation, and powerful Bonus Depreciation—fit together to accelerate tax benefits.
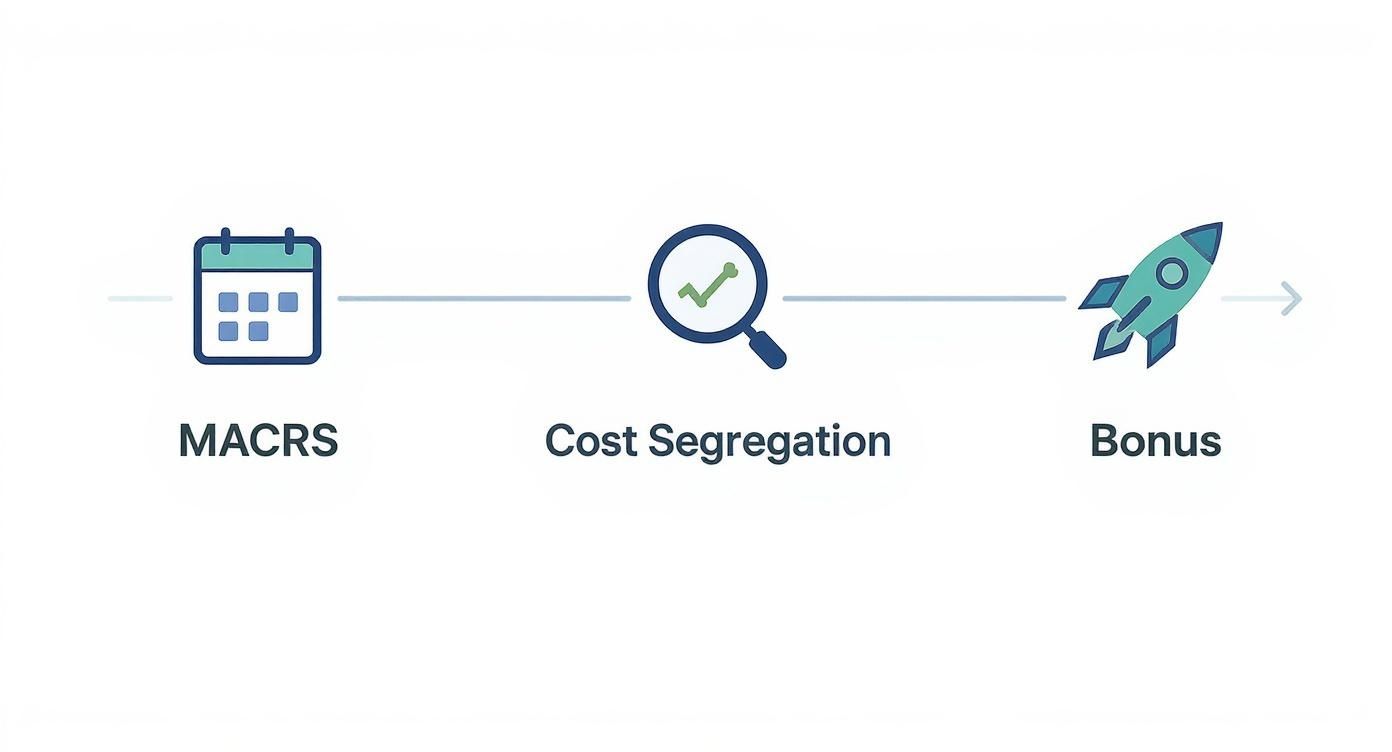
This visual timeline shows how an investor can move from a slow-and-steady depreciation schedule to a highly accelerated one by using more advanced tax tools. This strategic acceleration isn't just a niche U.S. tax trick; it’s a critical part of corporate finance across the globe. For a deeper dive, check out our definitive guide to investment real estate tax benefits.
In fact, analysis of corporate tax data in major markets shows that non-debt tax shields, driven primarily by depreciation, play a huge role in financial policy. This underscores how capital-intensive industries like real estate benefit enormously by investing heavily in fixed assets—a dynamic that influences billions in investment decisions every year.
Risks & Mitigations for Depreciation Strategies
While the power of depreciation tax shields is a massive advantage, it's not a magic wand. Experienced investors know this isn't about tax elimination; it's a strategic tool for tax deferral. At Stiltsville Capital, we model these factors from day one to paint a clear, institutional-grade picture of an investment's true after-tax returns.
Risk: Depreciation Recapture * Mitigation: There’s no free lunch in the tax code. When you sell, the IRS "recaptures" the depreciation you've taken. Straight-line depreciation is taxed at a maximum of 25%, while accelerated depreciation can be taxed at higher ordinary income rates. A quality sponsor models this recapture explicitly in their exit projections and may use a 1031 exchange to defer the tax event entirely.
Risk: Passive Activity Loss (PAL) Rules * Mitigation: The IRS generally prevents passive investors from using real estate losses to offset active income (like a salary). Your depreciation benefits are typically contained within your passive investment portfolio. Losses can be carried forward to offset future passive gains, a key feature for long-term portfolio management.
Risk: Shifting Tax Policy * Mitigation: Tax laws change. Bonus depreciation percentages, recapture rates, and capital gains rules are subject to legislative updates. A diligent sponsor stays abreast of potential changes and stress-tests their financial models against different tax scenarios to understand potential impacts on investor returns.
Questions Every Investor Should Ask A Sponsor

Knowing the theory is one thing; putting that knowledge to work when vetting a real estate sponsor is what really matters. A sophisticated sponsor sees tax planning not as a year-end chore, but as a central part of creating value from day one.
Investor Due Diligence Checklist:
Do you conduct cost segregation studies on all qualifying acquisitions? The only right answer is an immediate "yes." Any hesitation requires a very strong explanation for leaving this powerful tool on the table.
Which engineering firm do you use for these studies? Good sponsors have established relationships with reputable firms known for producing solid, defensible reports that will stand up to IRS scrutiny.
What percentage of the basis do you typically reclassify to shorter-life assets? A seasoned sponsor should be able to provide a historical range (e.g., 20-30%) for similar deals.
Can you walk me through the after-tax return pro forma? Make them show you, line by line, where the depreciation deductions are and how they calculate the tax shield.
How do you model for depreciation recapture upon sale? Their financial model must differentiate between Section 1250 recapture (max 25% tax) and Section 1245 recapture (ordinary income rates). If it doesn't, you aren't seeing the true net profit picture.
How do you handle K-1 tax document delivery? A professional sponsor will have a firm deadline and stick to it, as timely delivery is critical for your own tax filing.
Is it possible for my CPA to speak with your tax team? A sponsor who welcomes this conversation demonstrates transparency and confidence in their strategy.
Conclusion: A Prudent Part of Your Portfolio
The depreciation tax shield is more than just a line item on a tax return; it's a fundamental value driver in real estate investing. By converting current ordinary income into future, lower-taxed capital gains, it directly enhances cash flow and boosts overall returns. For family offices and high-net-worth investors, mastering this concept is essential for building a resilient, tax-efficient portfolio of real assets.
While risks like depreciation recapture and changing tax laws exist, they can be effectively managed by partnering with an experienced sponsor who prioritizes sophisticated, transparent tax strategy. At Stiltsville Capital, we believe that well-structured real estate, with its unique tax advantages, remains a prudent and powerful component of any long-term wealth strategy.
Ready to Enhance Your Portfolio's Tax Efficiency?
If you are an accredited investor interested in learning how institutional-grade real estate can fit into your wealth strategy, we invite you to connect with us.
Schedule a confidential call with Stiltsville Capital
Disclaimer:Information presented is for educational purposes only and does not constitute an offer to sell or a solicitation of an offer to buy securities. Any offering is made only through definitive offering documents (e.g., private placement memorandum, subscription agreement) and is available solely to investors who meet applicable suitability standards, including “Accredited Investor” status under Rule 501 of Regulation D. Investments in private real estate involve risk, including loss of capital, illiquidity, and no guarantee of distributions. Past performance is not indicative of future results. Verification of accredited status is required for participation in Rule 506(c) offerings.