top of page
Search

Reading Time 6 min | Good for: Novice Investors (A), Family Office Principals (B)


TL;DR: Key Takeaways on Syndication Returns


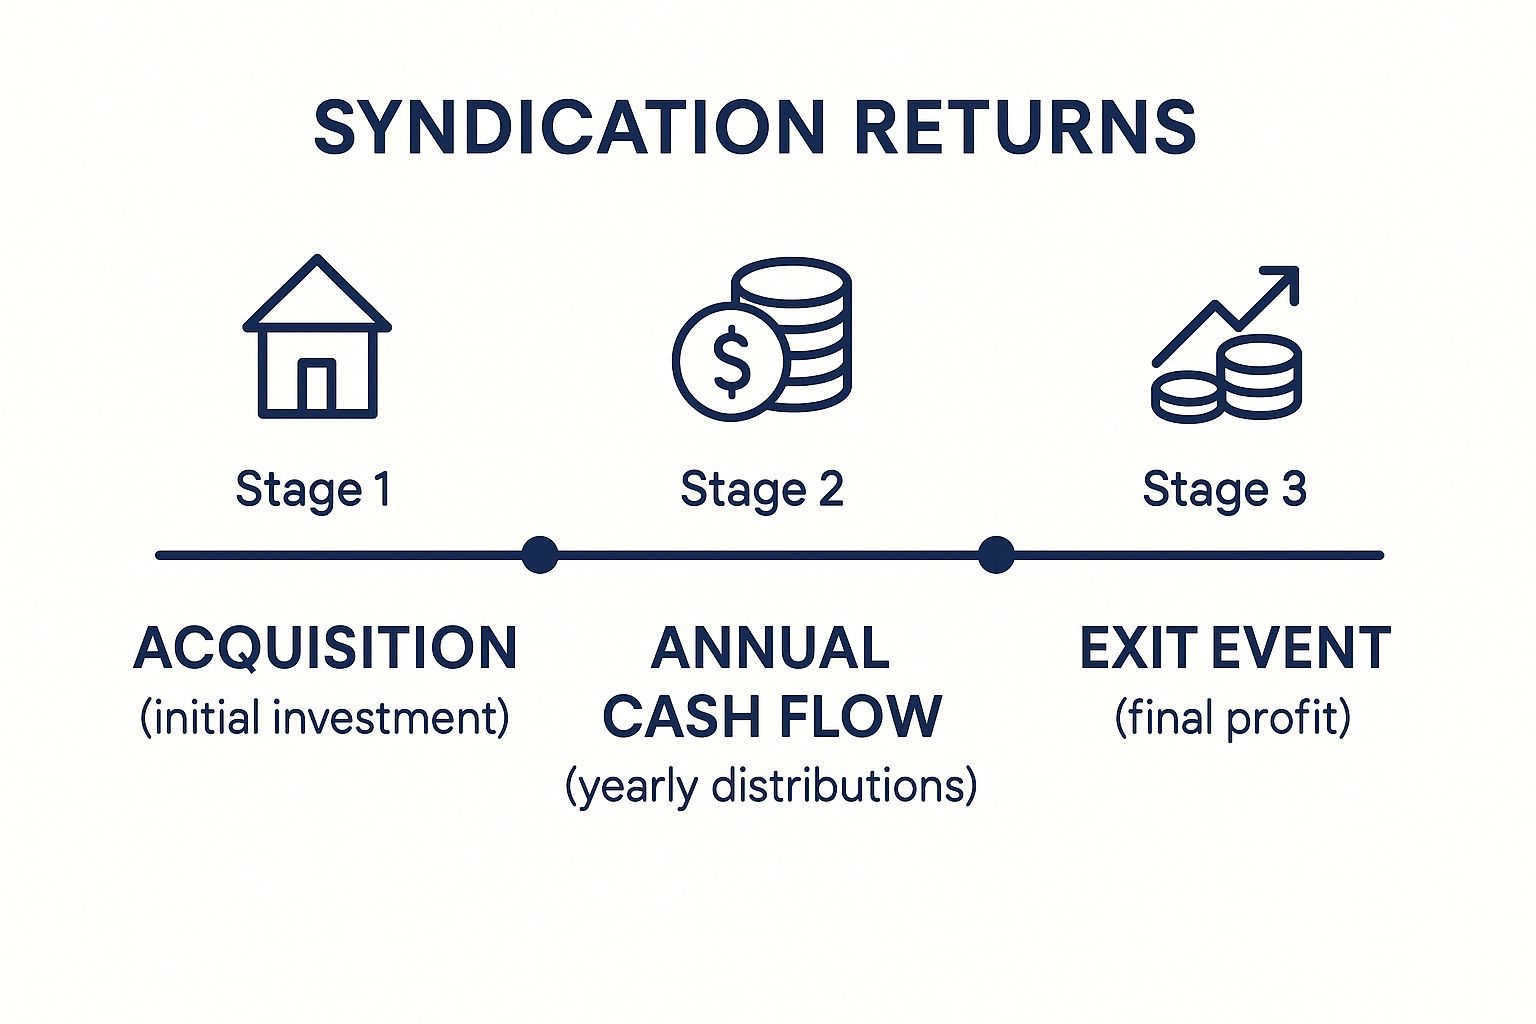
  • Dual Profit Engines: Real estate syndication returns are driven by two sources: consistent cash flow from property operations and capital appreciation realized at the sale or refinance.

  • Key Metrics to Master: To properly evaluate a deal, you must analyze three core metrics together: the Internal Rate of Return (IRR), Cash-on-Cash (CoC) Return, and the Equity Multiple. Relying on just one can be misleading.

  • Typical Target Ranges: While every deal is unique, well-structured value-add syndications often target a 7-12% average annual cash-on-cash return and a 15-20% total annualized return (IRR).

  • Sponsor Assumptions Matter: Projections are only as good as the sponsor's underwriting. Diligent investors must question key assumptions like rent growth, exit capitalization (cap) rates, and expense forecasts.


The Market "Why-Now": The Shift to Tangible Assets


Sophisticated investors are increasingly allocating capital toward private real estate, and for good reason. In a world of volatile public markets and persistent inflation, tangible, income-producing assets provide a compelling blend of stability and growth.


A 2023 survey by Campden Wealth revealed that North American family offices now allocate an average of 17% of their portfolios to direct real estate investments, with many planning to increase that number (as of Q4 2023). This strategic shift underscores a strong conviction in the asset class's ability to preserve wealth and deliver attractive, risk-adjusted returns. For investors seeking both income and appreciation, understanding how real estate syndication returns are generated is the first step toward participating in this trend.


Demystifying Real Estate Syndication Returns


Before you can make a smart investment, you must understand exactly where the money comes from. Unlike a simple stock dividend, syndication returns are multifaceted. Sponsors design these deals to deliver value to investors in two distinct ways:


  • Ongoing Cash Flow: This is the regular income—often paid out quarterly—that comes from the property's net operating income (NOI). Think of it as the property's profit after all the bills are paid but before the mortgage is covered.

  • Capital Appreciation: This is the big one. It’s the growth in the property's value over the hold period, which you realize when the asset is sold or refinanced. In most value-add deals, this is where the lion's share of the profit is made.


ree


Setting Realistic Expectations


For anyone evaluating these deals, it's critical to ground your expectations in reality. So, what’s a typical target?


Historically, real estate syndication returns average between 15% to 20% in total annualized returns for investors. But we need to break that down. The cash-on-cash return, which is a simple measure of your annual cash income against your initial investment, usually lands between 7% to 12%.


Meanwhile, the internal rate of return (IRR)—a more sophisticated metric that accounts for the timing of your money—often targets the 10% to 15% range. These numbers show you how syndications work to provide both immediate income and long-term appreciation. You can get more real-world insights on what you can actually make when investing on Disruptequity.com.


The Three Key Metrics to Master


To really understand any deal, you need to speak the language of returns. Sponsors might throw a dozen numbers at you, but your focus should boil down to three core metrics. Together, they paint the full picture of an investment’s potential.


Investor Takeaway: A single metric can be misleading. A high IRR might hide a long wait for your capital, while a great cash-on-cash return could mean there's little long-term growth. True diligence means looking at all three key metrics together.

Here's a quick look at the main performance metrics you'll see in just about every syndication deal.


Typical Return Metrics in Real Estate Syndication


Metric

What It Measures

Typical Target Range

Internal Rate of Return (IRR)

The total annualized return, factoring in the time value of money.

10% - 15%

Cash-on-Cash (CoC) Return

Your annual pre-tax cash flow as a percentage of your initial investment.

7% - 12%

Equity Multiple

The total cash you get back divided by the total cash you put in.

1.75x - 2.25x


These are the indispensable metrics. Mastering them is non-negotiable for anyone serious about building a high-performing real estate portfolio.


  1. Internal Rate of Return (IRR): The big-picture number showing your total annualized return, factoring in when you get your money back.

  2. Cash-on-Cash (CoC) Return: The "mailbox money" metric, showing your annual cash flow relative to your initial investment.

  3. Equity Multiple: The simplest of them all—it tells you how many times you'll get your money back over the life of the deal.


Learning these three lets you compare different opportunities on an apples-to-apples basis. It helps you align your capital with deals that actually match your goals, whether you’re chasing immediate income or long-term wealth.


The Three Pillars of Syndication Returns


When you're looking at real estate syndication returns, you can't just fixate on a single headline number. An investment’s real performance is a story told through three distinct, but deeply connected, metrics. Getting a firm grip on these pillars—the Internal Rate of Return (IRR), Cash-on-Cash (CoC) Return, and the Equity Multiple—is what separates a wild guess from a calculated investment decision.


Think of them as the vital signs of a deal. One metric might look great, but you need to check all three for a complete diagnosis.


IRR: The All-In-One Performance Grade


First up is the Internal Rate of Return (IRR), the most comprehensive of the three. It calculates the total annualized return on your money, but with a critical twist: it cares a lot about when you get paid. Money in your pocket today is worth more than the same amount years from now, and IRR captures this "time value of money."


Novice Lens: Why IRR MattersThink of IRR as the investment’s final, time-weighted report card. It doesn’t just tell you how much you made; it tells you how hard and how fast your capital was working for you. It's the ultimate equalizer, letting you compare a three-year project to a five-year project on an apples-to-apples basis.

A high IRR, often targeted between 10% and 15%, usually means profits are returned relatively quickly. However, a savvy investor knows to look closer. A sponsor can sometimes inflate a projected IRR by forecasting an unrealistically short hold period. It’s a powerful metric, but never look at it in a vacuum.


Cash-on-Cash Return: Your Annual Paycheck


While IRR gives you the big picture, the Cash-on-Cash (CoC) Return is all about the here and now. It’s a wonderfully simple metric showing the annual cash flow you receive compared to the cash you put in.


If you put $100,000 into a deal and get $8,000 back in distributions that year, your Cash-on-Cash return is 8%. Simple as that.


Investors focused on generating passive income love this metric. Deals with a strong and steady CoC, typically aiming for 7% to 12%, can provide a reliable stream of cash. The usual trade-off? A deal with a monster CoC might not have the same explosive growth on the back end. If you're curious how this fits into the broader strategy, you can explore our guide to private equity real estate investing.


Equity Multiple: The Final Scoreboard


Last but not least, the Equity Multiple gives you the clearest, most direct measure of success: how many times did you multiply your money? It’s calculated by dividing the total cash you get back (from both annual cash flow and the final sale) by the total cash you put in.


An Equity Multiple of 2.0x means you doubled your money—you invested $100,000 and got $200,000 back over the life of the deal.


While beautifully simple, the Equity Multiple has one major blind spot: time. A 1.8x multiple achieved in just three years is a much better outcome than a 2.0x multiple that took ten years to hit. That’s why you always use it alongside IRR, so you can understand both the size and the speed of your return.


How Returns Are Actually Generated


Knowing the key metrics is one thing, but understanding how a sponsor engineers those returns is where the real magic happens. Real estate syndication returns aren't pulled out of a hat. They’re the direct result of a smart, disciplined business plan, driven by two fundamental profit engines: day-to-day cash flow and long-term appreciation.


Think of an apartment building like any other business. Rent is your revenue, and expenses are your costs. What’s left over is the profit—the core of your return.


ree


Engine 1: Cash Flow from Operations


The first source of returns is the property’s operational cash flow. This is the investment's lifeblood, providing the steady stream of capital for investor distributions. It all starts with Gross Potential Rent and ends with Net Operating Income (NOI). This NOI figure is the single most important number for analyzing a property's cash flow and determining its value. It's the pure, unleveraged profit the asset generates before any mortgage payments are made.


Engine 2: Capital Appreciation at Exit


The second—and often much larger—piece of the puzzle is capital appreciation. This is the growth in the property's value over the hold period. A good sponsor doesn't just hope the market lifts the property's value. They actively force appreciation by executing a value-add business plan. Common strategies include:


  • Unit Renovations: Upgrading kitchens and baths to justify higher rents.

  • Amenity Enhancements: Adding a modern fitness center or dog park.

  • Operational Efficiencies: Installing energy-efficient lighting to cut expenses.


Here's the powerful part: every dollar added to the NOI can translate into $15-$20 of additional property value, depending on the market cap rate. This multiplier effect is how a well-executed plan generates substantial profits for investors at the exit.


Understanding the Waterfall Distribution


So, how is all this profit divided? This is laid out in the "waterfall" structure, which ensures an orderly, tiered distribution of profits.


Insight Edge: The Return Driver StackIn a typical value-add deal, the total return is a "stack" of several levers:* Rent Growth (40-50%): The primary driver, from renovations and market increases.* Expense Reduction (10-15%): Achieved through operational efficiencies.* Debt Paydown (10-15%): The mortgage portion paid down, increasing equity.* Cap Rate Compression (Variable): Market-driven changes in the exit valuation. A skilled sponsor underwrites conservatively here.

The most common waterfall includes a preferred return, or "pref." Think of this as a hurdle rate—often 6% to 8% annually—that limited partners (investors) receive before the sponsor gets any share of the profits. It’s a crucial feature that aligns interests by ensuring investors get paid first.


For a deeper look into how this priority position works, you can read our breakdown of what preferred equity is for real estate investors.


Once the "pref" has been paid, remaining profits are split according to a predetermined ratio, like 70/30 (70% to investors, 30% to the sponsor). The sponsor's share is their incentive to maximize the deal's performance.


A Practical Look Inside A Sample Deal


Theory is great, but seeing how the numbers play out in a real deal makes it all click. Let's walk through a simplified, but realistic, case study of a value-add multifamily deal.


Setting The Stage: The Acquisition


Let’s imagine Stiltsville Capital spots a 100-unit apartment complex in a growing market. The property is tired but in a great location, making it a perfect value-add candidate.


  • Purchase Price: $10,000,000

  • Renovation & Closing Costs: $2,000,000

  • Total Project Cost: $12,000,000


The sponsor uses both debt and equity. A lender provides a loan, while a group of Limited Partners provides the equity to close the deal and fund renovations.


  • Bank Loan (Debt): $7,500,000

  • Investor Equity (LP Capital): $4,500,000


This structure allows investors to control a $12 million asset with just $4.5 million of their own money—a classic example of using responsible leverage to amplify returns.


The Business Plan In Action: Years 1 to 5


Over the next two years, the sponsor renovates units, gives common areas a facelift, and brings in better property management. This allows them to raise average monthly rents from $1,000 to $1,300.


By year three, the property is stabilized and generating consistent cash flow. Let's say it throws off $360,000 in distributable cash each year. For an investor who put in $100,000, their annual distribution check would be $8,000.


Cash-on-Cash Return Calculation:($8,000 Annual Distribution / $100,000 Initial Investment) = 8.0% CoC Return

This provides a steady income stream while the property’s value keeps climbing.


ree


The Grand Finale: The Exit


After five years, the sponsor decides it's time to sell. Thanks to the increased Net Operating Income (NOI), the property is now worth much more.


  • Sale Price: $16,500,000

  • Remaining Loan Balance: $7,000,000

  • Sale Proceeds (before fees): $9,500,000


These proceeds are divvied up. First, the original $4,500,000 of investor equity is returned. The remaining $5,000,000 is profit, which is then split. A typical 70/30 split gives investors $3,500,000.


Our $100,000 investor's share of that sale profit is $77,700. Don't forget, they also collected $40,000 in cash flow over the five years.


Equity Multiple Calculation:($40,000 Total Distributions + $100,000 Capital Returned + $77,700 Sale Profit) / $100,000 Initial Investment = 2.18x Equity Multiple

What does that mean? For every dollar they put in, they got $2.18 back. When you run all cash flows through a calculator, the project clocks in with a deal-level IRR of 16.9%—a textbook example of a successful syndication.


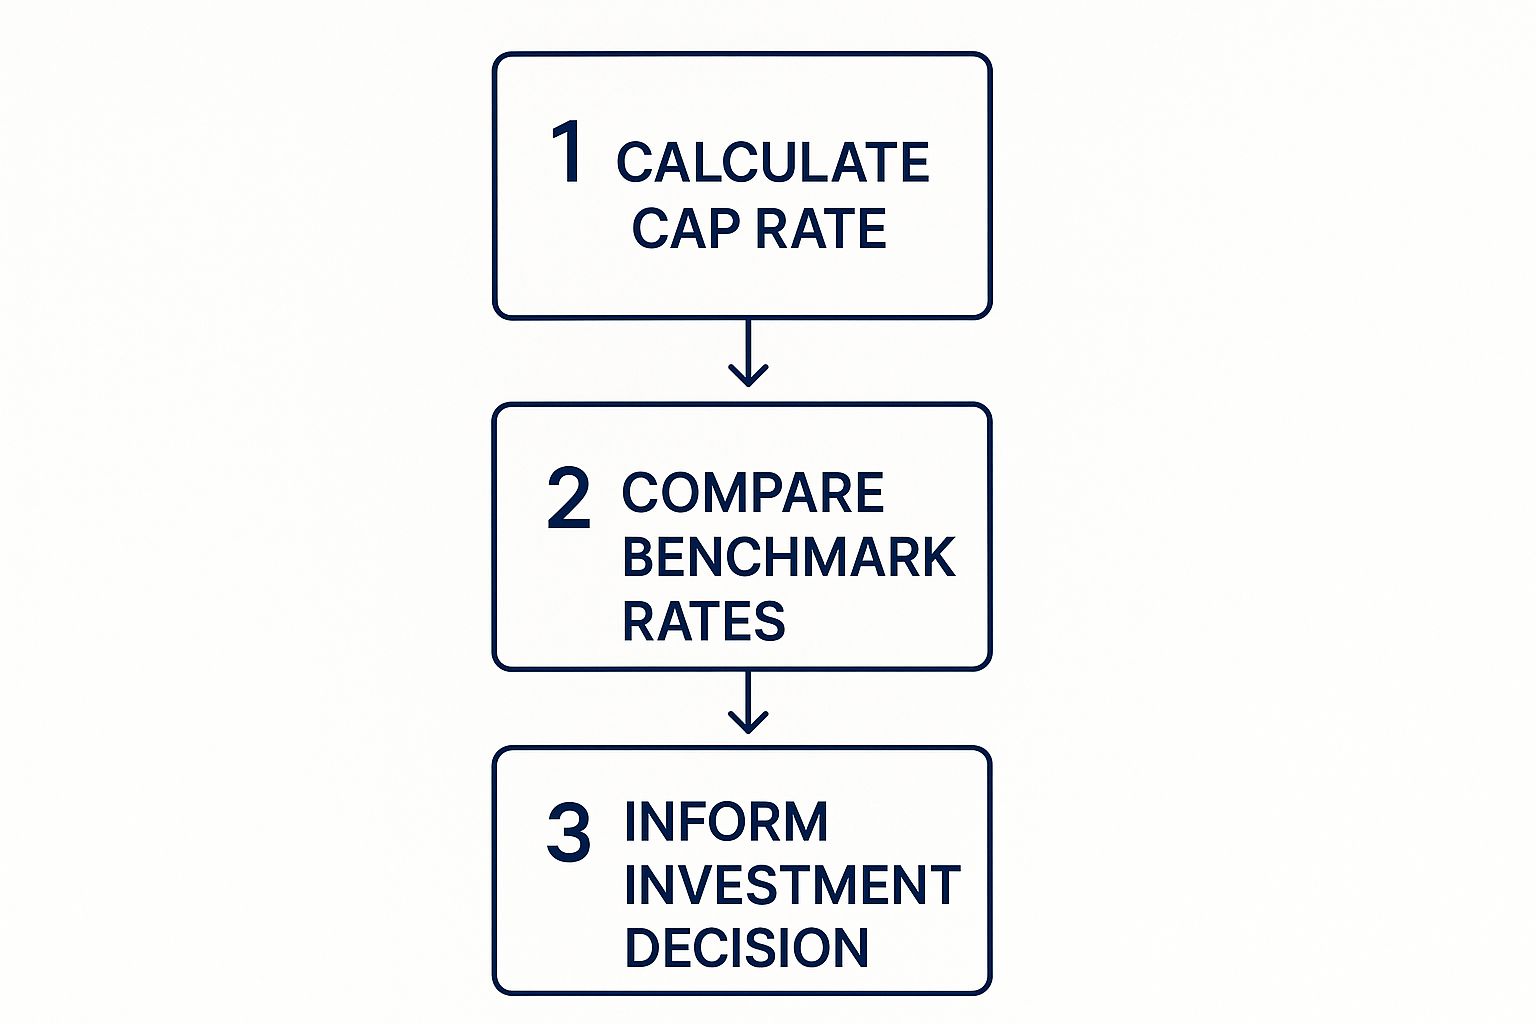
Benchmarking Returns Against Other Investments


ree


How do real estate syndication returns stack up against other investments? Context is everything. Private real estate offers a powerful blend of strong risk-adjusted returns, lower volatility than public stock markets, and a solid hedge against inflation. It's a tangible asset that produces real income—a quality that becomes incredibly valuable when the economy gets shaky.


Historical Performance: Real Estate vs. Stocks and Bonds


Over the long term, real estate has more than held its own. One 145-year global study of 16 industrialized countries found that rental properties returned an average of 7.05% per year, edging out stocks at 6.89%.


More recently, from 1972 to 2023, publicly traded real estate (REITs) delivered an average annual return of 11.1%, nearly neck-and-neck with the S&P 500's 12.1% average return. Private real estate syndications often do even better thanks to their focused, value-add strategies and hands-on operational improvements.


The Private Market Premium


Why the outperformance? A big part is the "illiquidity premium." Because private real estate can't be sold with the click of a button, investors expect to be compensated with higher potential returns. The National Council of Real Estate Investment Fiduciaries (NCREIF) consistently shows that private commercial real estate has historically been far less volatile and delivered more stable returns than publicly-traded REITs, which get tossed around by the daily whims of the stock market.


This stability is a huge draw for anyone looking to build a resilient, long-term portfolio. For a deeper dive, check out our guide on what makes a Class A building stand out.


Key Questions To Ask A Sponsor About Returns


Getting a handle on the key metrics is one thing. But the real work begins when you pressure-test the assumptions a sponsor uses to create those shiny projections. A pro forma is only as good as the numbers plugged into it. This is where you shift from being a passive investor to an active analyst.


Investor Checklist: Questions to Ask a Sponsor


  1. Rent Growth: What annual rent growth are you projecting, and how does that compare to the submarket’s actual 3-year average?

  2. Exit Cap Rate: What is the target exit cap rate? Is it higher than the purchase cap rate to build in a margin of safety?

  3. Vacancy Rate: What are you assuming for both economic and physical vacancy? How does this align with the property’s history and current market trends?

  4. Operating Expenses: How did you model for expense growth, particularly for property taxes and insurance?

  5. Downside Scenarios: Can you show me a sensitivity analysis? How do the returns hold up if rent growth or the exit cap rate miss projections by 10%?

  6. Refinance Risk: If a refinance is planned, what is Plan B if interest rates are higher than expected?

  7. Break-Even Occupancy: How far can occupancy drop before the property can no longer cover its debt service?

  8. Sponsor "Skin in the Game": How much of your own capital are you (the sponsor) personally investing in this deal alongside the limited partners?


Risk & Mitigation: A Disciplined Approach


Experienced sponsors don't just hope for the best; they plan for potential challenges.


  • Risk: Market Downturn * Mitigation: Focus on markets with diverse economic drivers. Underwrite conservative rent growth and build a capital reserve for unexpected vacancies.

  • Risk: Interest Rate Hikes * Mitigation: Secure long-term, fixed-rate debt when possible. Purchase interest rate caps to limit exposure on floating-rate loans. Stress test for higher rates.

  • Risk: Execution Delays * Mitigation: Partner with sponsors who have a proven track record. Get multiple bids from vetted contractors and include a healthy contingency budget (10-15%).

  • Risk: Liquidity Constraints * Mitigation: Invest with a long-term mindset. Ensure you have sufficient liquid reserves outside of the investment so you won't be forced into a premature sale.


Ultimately, no investment is without risk. The key is to partner with a sponsor who has a clear, battle-tested strategy for navigating potential threats.


Your Questions Answered


When you're digging into real estate syndication, a few practical questions always pop up. Let's tackle some of the most common ones we hear from investors.


How Are Syndication Returns Taxed?


This is where real estate really shines. One of the most powerful perks of investing in syndications is how tax-efficient they are. As a passive partner, you'll get a Schedule K-1 form, not a 1099. That form allows you to benefit from the property’s depreciation, a "paper" expense that can offset the actual cash income you receive. For many investors, this means the distributions they pocket in the first few years are often partially or even completely tax-sheltered.


When Do Investors Start Receiving Distributions?


It all comes down to the business plan. For a stable, cash-flowing property, you could see your first quarterly distribution within three to six months after closing. For a heavy value-add or development project, the sponsor might pause distributions for the first 12-18 months while they put your capital to work stabilizing the property. This should be spelled out clearly in the investment documents.


Investor TakeawayAlways check the projected distribution schedule in the Private Placement Memorandum (PPM). Knowing the cash flow timeline is critical for matching an investment with your financial goals and setting the right expectations for when you'll start seeing a return on your capital.


Well-structured real estate assets can be a prudent, resilient component of a long-term wealth strategy. While the returns are compelling, they are achieved through disciplined underwriting and active management of inherent risks like illiquidity and market cycles.


Ready to see how institutional-grade real estate could fit into your portfolio? The team at Stiltsville Capital is here to provide the clarity and access you need.


Schedule a confidential call with Stiltsville Capital today to discuss your investment goals and learn more about our current opportunities.


Information presented is for educational purposes only and does not constitute an offer to sell or a solicitation of an offer to buy securities. Any offering is made only through definitive offering documents (e.g., private placement memorandum, subscription agreement) and is available solely to investors who meet applicable suitability standards, including “Accredited Investor” status under Rule 501 of Regulation D. Investments in private real estate involve risk, including loss of capital, illiquidity, and no guarantee of distributions. Past performance is not indicative of future results.


Reading Time 7 min | Good for: Novice Investors (A), Family Offices (B)


Imagine upgrading your real estate portfolio without an immediate tax bill slowing you down. That's the core power of a tax deferred exchange, better known as a §1031 exchange. Think of it as a strategic reinvestment tool that lets you swap one investment property for another, all while pushing capital gains taxes down the road. This move preserves your capital and maximizes your purchasing power, letting you build your portfolio more aggressively.


TL;DR: Key Takeaways


  • What it is: A tax deferred exchange (§1031) allows you to sell an investment property and reinvest the full proceeds into a new one, postponing capital gains taxes.

  • Why it matters: It accelerates wealth creation by allowing 100% of your capital to stay invested and compound, enabling you to acquire larger or better-performing assets.

  • How to do it: You must follow strict IRS timelines (45 days to identify, 180 days to close) and use a Qualified Intermediary to handle the funds.


How a Tax Deferred Exchange Builds Wealth


For any serious real estate investor, the tax deferred exchange is a cornerstone strategy for scaling a portfolio efficiently. At its heart, the mechanism lets you roll the full value from the sale of one property directly into the purchase of another, postponing the capital gains tax you’d otherwise have to pay right away.


Let's be clear: this isn't tax avoidance; it's tax deferral. The tax obligation doesn't just vanish—it gets kicked into the future. This allows 100% of your sale proceeds to keep working for you today, creating a powerful compounding effect that can seriously accelerate how quickly you build wealth.


ree


The Compounding Advantage of Deferral


Here’s a simple analogy. If you sell your sedan for a profit and immediately use all that money—including your profit—to buy a bigger SUV, a §1031 exchange is like making that trade without having to hand over a cut of your profit to the government first. You get to use the full value for your upgrade.


That preserved capital becomes a massive advantage. Instead of losing 15% to 20% (or more) of your gains to federal and state taxes after a sale, that money stays invested and keeps generating returns. Do that over multiple transactions, and the difference is huge.


It's no wonder investors use this strategy to:


  • Increase Purchasing Power: By reinvesting the full, pre-tax proceeds, you can afford larger, higher-value, or better-performing assets than you could if taxes took a bite out of your capital.

  • Scale Portfolios Faster: Each deal builds on the full value of the last one. This creates a compounding growth curve that leaves the traditional "sell, pay tax, then reinvest" cycle in the dust.

  • Diversify Holdings: An exchange can be used to pivot your portfolio into different types of assets or geographic markets without triggering a taxable event. For instance, you could exchange a high-maintenance rental house for a passive stake in an institutional-quality medical office building.


Novice Lens / Why it Matters: For newer investors, this means you can climb the property ladder much more quickly. For a family office or CIO, it's a critical tool for managing a portfolio efficiently, repositioning assets, and preserving wealth over the long haul.

A Strategic Reinvestment Tool


Ultimately, the tax deferred exchange is far more than just a tax-saving trick; it’s a fundamental part of a dynamic real estate investment strategy. It gives you the flexibility to adapt to market shifts, upgrade the quality of your properties, and even transition from active to passive management—all while keeping your capital fully deployed and working for you.


For a deeper dive into the mechanics, you can explore our comprehensive guide on **what a 1031 exchange is** and how it compounds wealth. By understanding and properly executing this strategy, you can unlock some serious potential for portfolio growth.


Mastering the Critical Exchange Timelines


When it comes to a successful tax-deferred exchange, the clock is everything. The timelines are strict, non-negotiable, and failing to meet them is the fastest way to blow up the entire transaction and trigger a nasty tax bill. For investors, getting this framework right isn't just important—it's the whole ballgame.


The countdown starts the second the sale of your original property closes. From that day forward, two critical clocks start ticking at the same time. And they are absolute. There are no extensions for weekends, holidays, or a sudden market downturn.


The 45-Day Identification Period


First up, you have exactly 45 calendar days to formally identify potential replacement properties. This isn't just about window shopping; you have to submit a signed, written declaration to your Qualified Intermediary. That deadline is notoriously tight, which is why savvy investors start lining up potential deals long before their original property is even sold.


To give you some flexibility while keeping you compliant, the IRS gives you three ways to identify your next property:


  • The 3-Property Rule: This is the most common and straightforward path. You can identify up to three potential properties, no matter what they cost. For most exchanges, this gives you more than enough options to get a deal done.

  • The 200% Rule: If you need more properties in your pipeline, this rule lets you identify any number of them, as long as their total market value doesn't top 200% of what you sold your property for. Sell a building for $2 million? You could identify five properties with a combined value of up to $4 million.

  • The 95% Rule: This is the most flexible but also the riskiest option by far. You can identify as many properties as you want, but you have to close on at least 95% of the total value you identified. It's rarely used because of how tough that is to pull off, saved only for complex deals where the investor is almost certain they can close on nearly everything.


The 180-Day Closing Period


The second deadline runs at the same time as the first. You have a total of 180 calendar days from the day you sell your property to complete the purchase of one or more of the properties you identified.


Let's be clear: this isn't 45 days plus another 180. The 180-day clock starts on the very same day as the 45-day clock. This means once your identification period ends, you have the remaining 135 days to handle due diligence, line up your financing, and get to the closing table.


This timeline lays out the key stages so you can see how the countdown works.


ree


As you can see, the whole process, from selling to buying, has to wrap up within a tight six-month window, with that critical identification milestone hitting very early on.


The Role of the Qualified Intermediary


Trying to navigate these timelines on your own is impossible without a Qualified Intermediary (QI), sometimes called an Accommodator. A QI is a required, independent third party whose job is to manage the exchange and make sure it follows every IRS rule.


Their most important job is to keep you from having "constructive receipt" of your money. If the cash from your sale hits your bank account, even for a second, the exchange is dead on arrival. Instead, the QI holds your funds in escrow after the sale and then wires them directly to the seller of your new property when you're ready to close.


Advanced Lens / Why it Matters: Picking a reputable, experienced QI is non-negotiable. They are the gatekeepers of your tax-deferred exchange, handling the legal documents, securing your funds, and ensuring every step you take meets the strict deadlines and regulations.

Recent policy changes really highlight how crucial good record-keeping is. In recent tax developments, the IRS actually expanded what counts as a "like-kind" property, but they also beefed up the reporting on Form 8824. They now demand stricter proof of your deadlines and compliance to ensure everything is above board. You can read more about these global tax transparency efforts on oecd.org.


Decoding the Like-Kind Property Rule


One of the most powerful—and most misunderstood—parts of a tax-deferred exchange is the “like-kind” property rule. It’s a common myth that you have to swap an identical property for another, like trading one apartment building strictly for a different apartment building.


That’s just not the case. This misconception holds investors back, but the reality is far more flexible and opens up a world of possibilities for repositioning your real estate portfolio.


ree


Defining Like-Kind in Real Estate


So, what does “like-kind” actually mean in a §1031 exchange? It’s not about the property’s grade or quality. It’s about its fundamental nature or character. The IRS rule is surprisingly broad: any real property held for productive use in a business or for investment is considered like-kind to any other real property held for the same purpose.


This means you can exchange across totally different real estate asset classes. Think about it: you could sell a portfolio of single-family rentals and exchange into a commercial retail center. Or, you could sell a plot of raw, undeveloped land and acquire an industrial warehouse.


The only real catch is that both the property you sell and the property you buy must be for investment or business use. Your personal residence doesn't count.


Novice Lens / Why it Matters: This flexibility is the strategic engine of the tax-deferred exchange. It allows you to shift your portfolio from a high-maintenance asset to a passive one, from a low-growth market to a high-growth one, or from one property type to another, all without triggering an immediate tax event.

Valid vs. Invalid Exchanges


To make this crystal clear, let's look at a few examples. Understanding these distinctions is critical to making sure your exchange is compliant and your tax deferral is protected.


The table below breaks down what works and what doesn't.


Valid vs. Invalid Like-Kind Exchanges


Example Exchange Scenario

Is it a Valid Like-Kind Exchange?

Reasoning

Exchanging a duplex for a medical office building.

Yes

Both are real properties held for investment purposes, so they are considered like-kind despite being different asset types.

Exchanging a primary residence for a vacation rental.

No

A primary residence is personal-use property, not an investment property, and therefore does not qualify for a tax-deferred exchange.

Exchanging a U.S. warehouse for undeveloped land in Germany.

No

The rule is strict: property in the United States can only be exchanged for other property located within the United States.

Exchanging a retail storefront for an interest in a Delaware Statutory Trust (DST).

Yes

The IRS recognizes a beneficial interest in a DST holding real estate as a valid like-kind replacement property.


As you can see, the definition is broad but has firm boundaries, especially when it comes to personal use and international properties.


Advanced Options for Sophisticated Investors


For accredited investors, family offices, and institutional players, the like-kind rule opens the door to some truly sophisticated, hands-off investment structures. Instead of buying another physical property yourself, you can complete a tax-deferred exchange into a fractional ownership vehicle.


Two of the most common structures are:


  • Delaware Statutory Trusts (DSTs): This is a popular route for investors who want to go from active landlord to completely passive investor. A DST allows you to acquire an interest in a trust that owns a portfolio of institutional-grade, professionally managed properties—all without a taxable event.

  • Tenants-in-Common (TICs): A TIC structure lets you own an undivided fractional interest in a larger property alongside other co-owners. While this route offers more direct control than a DST, it also comes with more shared responsibilities.


These advanced strategies offer a powerful way to diversify a portfolio, get access to higher-quality assets, and completely eliminate the day-to-day headaches of property management, all while keeping your capital gains deferred.


How to Avoid Taxable Boot in Your Exchange


When you're doing a 1031 exchange, the name of the game is to defer 100% of your capital gains tax. But there's a catch, a sneaky little thing the IRS calls "boot." Think of it as anything you receive in the exchange that isn't "like-kind" property. If you end up with boot, you’re looking at a tax bill.


Frankly, understanding and sidestepping boot is what separates a flawless, fully tax-deferred exchange from one that lands you an unexpected invoice from Uncle Sam. It’s the most common pitfall investors stumble into.


Understanding the Two Types of Boot


Boot can creep into your deal in two main ways: as cash or as debt relief. Spotting them is the first step to keeping your exchange clean.


  • Cash Boot: This one is pretty straightforward. It’s any cash you walk away with from the sale of your old property. This happens if you don't reinvest every single dollar of your proceeds into the new property. It can also include personal property sold with the building, like furniture or equipment.

  • Mortgage Boot (Debt Relief): This one is a bit more subtle. Mortgage boot happens if the mortgage on your new property is less than the mortgage you paid off on the old one. The IRS sees this reduction in debt as a financial gain for you, and they’ll tax it accordingly.


To pull off a fully tax-deferred exchange, you have to buy a replacement property of equal or greater value, roll all your cash proceeds into it, and take on an equal or greater amount of debt.


Deal Lens Example: Calculating Boot


Let's run the numbers on a real-world scenario to see how easily boot can pop up and create a tax liability. This is exactly why meticulous planning is a must.


Imagine you sell an investment property with these figures:


  • Sale Price: $1,000,000

  • Mortgage Payoff: $400,000

  • Sale Proceeds (Equity): $600,000


You then find a replacement property and close the deal:


  • Purchase Price: $900,000

  • New Mortgage: $350,000

  • Cash Invested: $550,000


In this case, you've accidentally created both cash and mortgage boot:


  1. Cash Boot: You had $600,000 in proceeds but only reinvested $550,000. That leftover $50,000 is cash boot and is now taxable.

  2. Mortgage Boot: Your new loan is $350,000, which is $50,000 less than your old $400,000 mortgage. That $50,000 in "debt relief" is mortgage boot.


Your total taxable boot here is $100,000 ($50,000 cash + $50,000 mortgage). While you still deferred a big chunk of your gain, this oversight just triggered a taxable event that could have been avoided.


Novice Lens / Why it Matters: For new investors, the lesson is clear: always aim to "trade up." For seasoned pros, this shows just how critical it is to structure the capital stack on the new deal to match or exceed the old one perfectly. Sometimes, bringing a little extra cash to the closing table is all it takes to offset mortgage boot and keep the full deferral intact.

The concept of a tax deferred exchange isn't new; it started back in the 1920s to encourage reinvestment in property. It's still a powerhouse strategy today, with IRS data showing thousands of these deals happen every year, moving billions in assets. You can find more details about this long-standing tax provision on treasury.gov.


For a complete walkthrough of the entire process, check out our guide on how the 1031 exchange compounds real estate wealth.


Advanced Exchange Strategies for Sophisticated Investors


Once you’ve mastered the standard delayed exchange, a whole new world of sophisticated strategies opens up. These advanced structures aren't just about kicking the tax can down the road; they're powerful tools for savvy investors looking to reshape their portfolios, swap high-maintenance properties for passive, institutional-grade assets, or even build value from the ground up.


A typical exchange is straightforward: you sell, then you buy. But what happens when the market doesn't play by those rules? Sometimes you need to lock down a high-demand property before selling your old one, or maybe you see a diamond in the rough that needs significant work. That’s where these advanced options come in.


ree


The Reverse Exchange


Ever find the perfect replacement property before you’ve even listed your current one? In a hot market, waiting to sell could mean losing the deal of a lifetime. That's the exact problem the Reverse Exchange was designed to solve.


Just like the name implies, it flips the entire process on its head. You get to acquire your new property first and sell your original one later.


So, how does this work without breaking the cardinal rule of not owning both properties at once? The magic is in a third-party entity called an Exchange Accommodation Titleholder (EAT). Your Qualified Intermediary sets up the EAT to temporarily "park" the title to either your old property or the new one you're buying. This clever workaround keeps you compliant while giving you the agility to pounce on an opportunity.


The timelines are just as strict, only in reverse. The clock starts ticking the moment the EAT takes title to the parked property. You get 45 days to officially identify the property you plan to sell and a total of 180 days to get it sold and close the loop.


The Improvement Exchange


Here’s another game-changer: the Improvement Exchange. You might also hear it called a construction or build-to-suit exchange. This structure lets you use your tax-deferred funds not just to buy a new property, but also to pay for major renovations or even new construction on it.


It's a dream come true for value-add investors. Imagine selling a stable apartment complex and rolling the proceeds into buying a rundown property, then funding a massive overhaul to boost its value—all using pre-tax dollars.


The mechanics are similar to a Reverse Exchange. An EAT holds the title to the new property while all the improvement work is being done, and your exchange funds are used to pay the contractors. The key rule here is that to fully defer your taxes, the value of the replacement property after all the improvements must be equal to or greater than the value of the property you sold.


These advanced strategies are incredibly powerful, but they are also more complex and carry higher costs than a standard exchange. Getting them right requires real expertise. To see how these tools fit into a larger wealth-building strategy, check out our **ultimate guide to real estate tax benefits**.


Market Signal Box: Exchange Trends (as of Q2 2024)Latest Data: Analysis from market intermediaries shows a recent uptick in specialized transactions like reverse and improvement exchanges. This is largely a response to tight inventory and a challenging financing climate, which is pushing investors to get more creative.Interpretation: The traditional "sell then buy" model isn't always viable in competitive markets. Smart investors are using these advanced structures to secure deals and manufacture their own value through development.Investor Take: This trend points to a broader shift toward more hands-on portfolio management. Simultaneously, we're seeing a surge in the use of passive investment vehicles like Delaware Statutory Trusts (DSTs) within exchanges. It shows investors want two things: flexibility to make strategic moves and options to shed management headaches. You can dig deeper into these **2025 exchange market trends at ipx1031.com**.

Investor Checklist: Questions to Ask Before Your Exchange


Executing a 1031 exchange takes precision and a proactive mindset. It's one thing to understand the theory, but putting it into practice is where things get real. Think of this checklist as your roadmap, framed as key questions to ask your professional team—your Qualified Intermediary (QI), attorney, and tax advisor—to make sure every detail is nailed down for a seamless transaction.


Vetting Your Qualified Intermediary


Your QI is the absolute linchpin of your exchange. Bringing the wrong one on board can torpedo the entire deal, so doing your homework isn't just a suggestion—it's non-negotiable.


  • How are my exchange funds secured? You need to know about their internal controls, fidelity bonding, and professional liability (Errors & Omissions) insurance. Your money should be held in a segregated, qualified trust or escrow account, never commingled with the QI’s own operating funds.

  • What's your track record and reputation? Ask how many exchanges they handle each year and don't be shy about asking for references. A seasoned QI brings a ton of expertise to the table, which is invaluable if things get complicated.

  • Are you part of the Federation of Exchange Accommodators (FEA)? Membership in the FEA is a good sign they’re committed to industry ethics and best practices.


Preparing Your Legal and Tax Framework


Getting your legal and tax ducks in a row from the very beginning can save you from incredibly costly mistakes later on. A single misstep here could blow up your entire exchange.


  • Does my sale agreement have a cooperation clause? Your attorney needs to make sure the sale contract for your relinquished property includes language that requires the buyer to cooperate with your 1031 exchange. This comes at no extra cost or liability to them and is a standard—but essential—clause.

  • Have we triple-checked the "same taxpayer" rule? Your tax advisor must confirm that the entity selling the old property is the exact same one buying the new one. Trying to change how you hold the title mid-exchange, like switching from your personal name to an LLC, is a classic way to disqualify the transaction.

  • How will we handle prorations and closing costs? Not every closing cost can be paid with exchange funds without creating a taxable event (known as "boot"). Go over the settlement statements with your advisor to sort out which costs are allowed and which ones you'll need to cover with cash from your pocket.


Executing Your Identification and Closing Strategy


The tight deadlines of a tax deferred exchange demand that you be prepared. Waiting for the clock to start ticking is a surefire recipe for disaster.


Investor Takeaway: The single biggest mistake investors make is failing to plan for the 45-day identification period. You should start looking for replacement properties months before you even think about listing your current asset.

A solid execution strategy should answer these questions:


  1. What’s our number one replacement property target? Have your top choice fully vetted and, if at all possible, under contract before that 45-day clock even starts.

  2. What are our backup options? You should always identify at least one or two other solid backup properties on your formal list. Markets shift, and deals fall apart when you least expect them to.

  3. Is our financing locked and loaded? Loan delays are one of the most common reasons investors miss the 180-day closing deadline. Make sure your lender understands the rigid timeline and is ready to move fast.


FAQ: Common Tax Deferred Exchange Questions


When you're navigating the ins and outs of a tax-deferred exchange, a few practical questions always seem to pop up. Let's tackle some of the most common ones to help you structure your deal correctly and sidestep those all-too-common pitfalls.


Can I Do a 1031 Exchange on My Primary Home?


In a word, no. A tax-deferred exchange is built exclusively for properties "held for productive use in a trade or business or for investment." Your family home is considered personal-use property, so it doesn't fit the bill under the IRS's strict guidelines.


Things can get a little murky, though, with mixed-use properties. Say you own a duplex, live in one half, and rent out the other. Or maybe you've converted a primary residence into a full-time rental. These situations demand careful planning and rock-solid documentation, making a conversation with your tax advisor an absolute must.


What Happens if I Miss the 45-Day Deadline?


The 45-day identification deadline is ironclad. There are no extensions and no second chances. If you miss it, your exchange is immediately terminated.


From there, the transaction is treated just like a standard sale. Your Qualified Intermediary will return your funds, and you’ll be on the hook for capital gains taxes from the sale of your original property. The opportunity to defer is gone for good. This is exactly why identifying several solid backup properties is such a crucial part of any smart exchange strategy.


Can I Do a Partial Exchange and Take Some Cash Out?


Yes, you absolutely can. This is a popular move called a partial exchange, and it gives investors some valuable flexibility. You can still successfully defer taxes on the portion of the funds you roll into a new like-kind property.


Just remember, any proceeds you don't reinvest are considered taxable "boot." This includes cash you pocket from the sale or any reduction in your mortgage debt. While you won't get the full tax deferral, it's a great option if you need to pull out some cash while still shielding the majority of your gains.


A successful tax-deferred exchange is all about careful planning and expert guidance. Well-structured real assets can be a prudent, resilient component of a long-term wealth strategy. At Stiltsville Capital, we help accredited investors navigate these complexities to build and preserve wealth through strategic real estate allocations. Schedule a confidential call to explore how our institutional-grade offerings can fit into your long-term financial strategy.


Information presented is for educational purposes only and does not constitute an offer to sell or a solicitation of an offer to buy securities. Any offering is made only through definitive offering documents (e.g., private placement memorandum, subscription agreement) and is available solely to investors who meet applicable suitability standards, including “Accredited Investor” status under Rule 501 of Regulation D. Investments in private real estate involve risk, including loss of capital, illiquidity, and no guarantee of distributions. Past performance is not indicative of future results. Verification of accredited status is required for participation in Rule 506(c) offerings.


Reading Time: 7 min | Good for: A, B


Figuring out a property’s cap rate is actually pretty straightforward. You take the Net Operating Income (NOI) and divide it by the property's current market value. It's a simple formula, but it gives you a powerful, quick look at an asset's unlevered annual return. That makes it a go-to tool for sizing up different investment opportunities.


TL;DR: Key Takeaways


  • The Formula: Cap Rate = Net Operating Income (NOI) / Property Market Value. This shows an unlevered, first-year return.

  • Why It Matters: It’s a clean, fast way to compare the raw income potential of different properties, regardless of financing.

  • What It Signals: Lower cap rates usually mean lower risk and a higher price. Higher cap rates suggest higher risk but potentially greater returns.

  • Next Step: Once you understand the cap rate, the next step is to evaluate how it fits within your broader portfolio goals for income, growth, and risk.


What Is a Cap Rate and Why Does It Matter for Investors?


ree


Think of the capitalization rate—or "cap rate"—as the North Star for real estate investors. It gives you an instant snapshot of a property’s potential profitability before you even think about financing. It cuts right through the noise of different debt structures to show you the raw, income-generating power of the asset itself.


For someone new to the game (Persona A), it’s the cleanest way to answer the big question: "For every dollar invested in this property, how much income does it generate annually before debt payments?" This metric levels the playing field, letting you fairly compare a multifamily complex in Austin with a medical office building in Miami.


For seasoned pros—family office principals and CIOs (Personas B & C)—the cap rate is a vital benchmark. It helps them gauge risk and opportunity across different markets and property types. A lower cap rate often signals a higher-quality, lower-risk asset in a prime location. A higher cap rate, on the other hand, might point to more risk, but also the potential for a much bigger payday in a value-add or opportunistic strategy.


The Core Formula Explained


At its heart, the calculation is a simple ratio. The formula is: Cap Rate (%) = NOI ÷ Market Value.


The NOI is the income a property brings in after you've paid all the direct operating expenses—things like property taxes, insurance, and maintenance. Crucially, this is before you factor in mortgage payments and income taxes. This simplicity is what makes the cap rate a cornerstone metric in real estate analysis. You can get a deeper dive into the formula's components over at Wall Street Prep.


To get a clearer picture, let's break down the two main ingredients you'll need.


Cap Rate Formula Components at a Glance


Component

Definition

What It Tells You

Net Operating Income (NOI)

A property's total income minus all reasonable operating expenses (excluding debt service and income taxes).

This is the pure, unfiltered profitability of the property itself. It shows how well the asset is performing on its own.

Market Value

The current price a property would likely sell for on the open market.

This represents the total capital investment required to purchase the asset at today's prices.


Knowing these two numbers gives you the power to calculate the cap rate and start comparing deals like a pro.


Why It Matters (for Novices): The cap rate is an "unlevered" metric, meaning it ignores financing. This is crucial because it allows you to assess the raw performance of the asset itself, independent of the debt structure an individual investor might use.

Key Applications for Investors


Knowing the formula is one thing, but knowing how to use it is what separates smart investors from the rest of the pack. Here are a few ways experienced investors put cap rates to work:


  • Quickly Screening Opportunities: Cap rates let you sift through dozens of potential deals fast. You can immediately filter out properties that don't meet your baseline return goals and focus your energy on the ones that do.

  • Assessing Market Trends: Are cap rates in a market "compressing" (going down) or "expanding" (going up)? Tracking this tells you a lot about property value trends and what other investors are willing to pay.

  • Benchmarking Performance: The cap rate lets you compare a property you're eyeing against similar ones that have recently sold. This is your reality check—it helps you figure out if the seller's asking price is actually reasonable.


Calculating Net Operating Income: The Bedrock of Your Analysis


If there's one thing you need to get right, it's your Net Operating Income (NOI). It's the absolute foundation of an accurate cap rate calculation. Garbage in, garbage out—it’s as simple as that.


Think of NOI as the property's pure, unadulterated profit before any debt is factored in. It’s the true engine of your return, so let's get it right. The process starts by looking at a property's total potential earnings and then methodically whittling it down to a realistic, defensible number. This isn't just an academic exercise; it's the foundation of a sound investment.


From Gross Potential to Effective Income


First, you start with the Gross Potential Income (GPI). This is the rosiest scenario imaginable—what the property could earn if every single unit were rented at full market rate for the entire year, with zero vacancies or defaults. It’s an optimistic, but necessary, starting point.


From there, we have to inject a heavy dose of reality. No property in the real world maintains 100% occupancy and collections forever. You need to subtract an allowance for Vacancy and Credit Loss, which gives you the Effective Gross Income (EGI).


Pro Tip for Novices: Don't just guess at a vacancy rate. Look at the property's actual historical performance. If you don't have that, consult market reports from major firms like CBRE or JLL for that specific submarket and property type. A 5% vacancy rate is a common placeholder, but real, local data is always better.

This visual shows exactly how calculating the cap rate fits into the bigger picture of investment analysis.


ree


As you can see, getting the cap rate right is the essential first move that lets you compare opportunities and make a final decision.


Subtracting True Operating Expenses


Once you have your EGI, it’s time to subtract all the legitimate operating expenses. These are the real, day-to-day costs required to keep the property running and the rent checks coming in. For a deep dive, check out our detailed guide on [how to find Net Operating Income](https://www.stiltsvillecapital.com/post/how-to-find-net-operating-income-a-clear-guide-for-real-estate-investors).


Here are the usual suspects:


  • Property Taxes: A non-negotiable expense based on the assessed value.

  • Property Insurance: Essential coverage for liability, fire, and other potential disasters.

  • Utilities: Any costs not passed directly to tenants, like electricity for common areas.

  • Repairs & Maintenance: The routine upkeep for plumbing, HVAC, landscaping, and all the little things that break.

  • Management Fees: Typically a percentage of EGI paid to a third-party manager to handle the headaches for you.


Add all those up, subtract them from your EGI, and you're left with the Net Operating Income. This is the cash flow available to pay your mortgage and, hopefully, put some money in your pocket.


What to Exclude from Operating Expenses


Knowing what not to include is just as important as knowing what to include. A lot of investors trip up here, which leads to an inflated and dangerously misleading NOI.


You absolutely must exclude these from your calculation:


  • Debt Service: Your mortgage payments (principal and interest) are financing costs, not operational ones.

  • Capital Expenditures (CapEx): Big-ticket items that extend the property's life, like a new roof or a full HVAC system replacement, are capitalized—they aren't part of the annual NOI.

  • Tenant Improvements (TIs): The money you spend to customize a space for a new commercial tenant.

  • Leasing Commissions: The fees paid to brokers for landing you those new tenants.


Advanced Lens (For Persona C): When we're underwriting a deal, we always "normalize" the expenses. If property taxes look suspiciously low, it's probably because they haven't been reassessed since the last sale. We adjust them to reflect what they'll actually be post-acquisition. The same goes for maintenance—if the current owner has been deferring costs, we budget for a higher, more realistic long-term average to avoid nasty surprises down the road.

Finding Market Value to Finalize Your Calculation


Once you've got a solid Net Operating Income (NOI), you're almost at the finish line. The last piece you need for the cap rate formula is the property’s current market value. And we don’t just mean the seller’s asking price—we need to figure out what the asset is really worth in today’s market. Smart investors have a few trusted methods to nail down this number.


ree


The whole point is to land on a defensible value that reflects current conditions. That’s how you make sure your cap rate calculation is both accurate and reliable.


Using Comps: The Comparative Market Analysis


The most common and, frankly, most intuitive method is the Comparative Market Analysis (CMA). You've probably heard it called "running comps." This is where you dig into recently sold properties that are as similar as possible to the one you're looking at—same location, size, age, condition, and property type.


By analyzing what those properties actually sold for, you can establish a very strong baseline for your target property's value. Think of it as the real estate equivalent of checking what your neighbor’s house sold for before listing your own. It's a powerful reality check because it’s grounded in real, recent market transactions, not just an optimistic asking price.


The Cost and Income Approaches


There are a couple of other valuation methods that offer a valuable perspective, especially for certain types of properties.


The Cost Approach figures out a property's value by estimating what it would cost to build a similar property from the ground up today, then subtracting depreciation. This method is most useful for brand-new developments or truly unique properties where finding good comps is next to impossible.


The Income Approach, on the other hand, is directly tied to our cap rate discussion. You can actually work backward with it. If you know the typical cap rate for similar properties in the area, you can determine a property's value by flipping the formula: Value = NOI / Market Cap Rate. Investors love this tool because it ties a property's value directly to its income-generating power.


To dive deeper into all these methods, check out our complete [guide to real estate property valuation methods for investors](https://www.stiltsvillecapital.com/post/a-guide-to-real-estate-property-valuation-methods-for-investors).


Tying It All Together: A Practical Example


Let’s bring this all home with an illustrative example.


  • Property Type: 20-unit multifamily building

  • Gross Potential Income: $240,000 (20 units x $1,000/month x 12 months)

  • Vacancy & Credit Loss (5%): -$12,000

  • Effective Gross Income (EGI): $228,000

  • Operating Expenses (45% of EGI): -$102,600

  • Net Operating Income (NOI): $125,400


After running a thorough CMA and analyzing the market, we determine its current market value is $2,200,000.


Now we can finally plug in the numbers:


Cap Rate = $125,400 (NOI) / $2,200,000 (Market Value) = 0.057 = 5.7%

This 5.7% cap rate represents the unlevered annual return you can expect from this asset. It's the critical number you’ll use to stack this deal up against other investment opportunities.


Investor Checklist: Questions to Ask a Sponsor


When a sponsor presents a deal, don't just take their NOI and value assumptions at face value. You need to dig in and understand how they got their numbers.


  • What comparable sales did you use to determine the property’s value, and how recent are they?

  • Can you share the trailing 12-month (T12) operating statement so I can verify the NOI calculation?

  • What vacancy rate and credit loss assumptions are you using in your pro-forma?

  • Have you factored in a potential property tax reassessment after the sale?

  • What are your underlying assumptions for rent growth and the exit cap rate in the financial model?


How to Read the Market Through Cap Rates


Getting the cap rate number is just simple math. The real skill—the part that separates seasoned pros from the newcomers—is knowing what that number is actually telling you.


There's no magic "good" cap rate you can find in a book. It's a living, breathing metric that shifts with the market's mood, reflecting the constant tug-of-war between risk and reward.


Think about it this way: a brand-new, fully-leased apartment building in a hot Sunbelt market will have a very different cap rate than a 20-year-old retail strip with shaky tenants in a less vibrant town. The apartment building feels safe and has growth potential, so investors will pay more for it, which pushes the cap rate down. The retail strip? It’s riskier, so buyers will demand a higher potential return for taking on that uncertainty, pushing the cap rate up.


The Push and Pull of Risk and Return


At its heart, the cap rate is a quick gut check on risk and value. If you can master this one concept, you’re already ahead of the game. It’s an inverse relationship:


  • Lower Cap Rates: These usually signal a safer, more stable investment. Think of a medical office fully leased to a major hospital system on a long-term contract. The income is about as reliable as it gets. Because it’s a secure bet, investors line up to buy it, bidding up the price and compressing the cap rate.

  • Higher Cap Rates: This is where things get interesting. A higher cap rate points to more perceived risk, but it also screams potential for a bigger payoff. This is the territory of value-add deals—properties with deferred maintenance or below-market rents that need an operator to come in and turn things around. The higher cap rate is your compensation for taking on that operational headache.


Investor Takeaway: Don't just chase the highest cap rate you can find. Stop and ask why it's so high. Is it a hidden gem waiting to be polished, or is it a sign of deep-rooted problems with the property, its tenants, or the neighborhood?

What’s Happening in the Broader Economy?


No property exists in a vacuum. Big-picture economic forces like interest rates, inflation, and job growth are always putting pressure on cap rates. When the Federal Reserve hikes interest rates, borrowing money gets more expensive. Suddenly, investors need a higher return from a property to make it worth their while compared to just parking their cash in a safe Treasury bond. This can push cap rates upward across the board.


For a deeper dive into what makes a cap rate truly attractive in different scenarios, check out our guide on **what is a good cap rate for real estate investors**.


Digging Deeper: Advanced Cap Rate Analysis and Common Pitfalls


If you want an institutional edge in underwriting, you have to move beyond the basic formula. The most sophisticated analysis looks at the entire lifecycle of an investment, and that means understanding the crucial difference between the cap rate on day one and the cap rate on the day you sell.


ree


The going-in cap rate is what we've been talking about so far—it’s based on your purchase price and the property's initial NOI. But any solid financial model has to project an exit cap rate (also called a terminal cap rate), which is the cap rate you anticipate when you eventually sell the property years from now. This single number is a huge driver in forecasting the property's future sale price and, ultimately, your total return.


Going-In vs. Exit Cap Rates


Here’s a pro tip: prudent underwriting almost always assumes an exit cap rate that is slightly higher than the going-in rate. This isn’t pessimism; it’s about building a conservative cushion into your projections. Assuming a higher exit cap rate means you’re planning for a lower future sale price relative to the income, which protects you if the market softens or interest rates tick up.


For instance, if you buy a property at a 5.5% cap rate today, you might model a sale in five years at a 6.0% exit cap rate. This kind of disciplined approach helps ensure your deal can handle future market shifts and still hit its return targets.


Insight Edge: A sponsor's exit cap rate assumption is a dead giveaway of their discipline. If their exit cap is lower than the going-in rate, you need to press them. Make them justify that optimism with hard data explaining why they expect market conditions to improve so dramatically.

The Band of Investment Technique


But what happens when you can't find clean market comps to guide you? This is where the band of investment technique comes in. It’s a powerful way to build a cap rate from the ground up by blending the cost of both debt and equity. Think of it like a Weighted Average Cost of Capital (WACC) framework, combining what the lender needs with what the equity investors expect.


Let's say a property is financed with 80% debt at a mortgage constant of 8.59% and 20% equity that requires a 15% return. The cap rate is simply the weighted average of the two. As PropertyMetrics explains in a detailed breakdown, the resulting cap rate would be 9.87%—a figure derived directly from the deal's real-world capital structure.


This method is invaluable when you’re looking at deals in niche markets or for unique assets where direct parallels are hard to find. It grounds your valuation in the actual cost of the capital needed to close the deal.


FAQ: Your Cap Rate Questions Answered


Even once you get the hang of the cap rate formula, real-world questions always pop up. This is where the theory meets the road. Let's tackle some of the most common questions investors have.


What's the real difference between Cap Rate and ROI?


This is a big one, and it's crucial to get right. The cap rate is about the property itself, completely ignoring any loans. It’s an unlevered metric. On the other hand, Return on Investment (ROI)—specifically your cash-on-cash return—is all about your specific deal and how much cash you put in. It’s a levered metric that accounts for your financing.


  • Cap Rate = NOI / Property Value (Tells you how the asset performs on its own.)

  • Cash-on-Cash Return = Annual Pre-Tax Cash Flow / Total Cash Invested (Tells you how your money is performing.)


A property could have a 6% cap rate, but after you layer on some smart financing, your actual cash-on-cash return might jump to 10% or even higher.


How do interest rates affect cap rates?


They're definitely connected, but it's not always a perfect one-to-one relationship. When interest rates go up, the cost of borrowing money gets more expensive, which naturally puts pressure on cap rates to rise as well. When safer investments like Treasury bonds start paying out more, real estate has to offer a better return to be worth the extra risk and hassle. As the team at Adventures in CRE points out, cap rates have always moved in response to these bigger economic tides.


The Bottom Line: Never look at a cap rate in a bubble. A 6% cap rate in a world where the 10-year Treasury is at 1.5% feels fantastic. That same 6% cap rate feels a lot less exciting when the 10-year is at 4.5%. What really matters is the spread—the gap between the cap rate and the risk-free rate.

Is a higher or lower cap rate better?


The honest answer? It completely depends on what you're trying to achieve.


  • A lower cap rate is what every seller dreams of because it means their property is worth more. For a buyer, it usually points to a high-quality, stable asset in a great location—think less risk, steady income, but probably lower immediate returns.

  • A higher cap rate is typically what buyers are hunting for. It suggests a lower purchase price for the income you're getting. This often signals a "value-add" play—a property with more risk but also more upside if you can turn it around through smart management.


Ultimately, the best cap rate is the one that aligns with your personal risk tolerance and what you want to accomplish with your investment. Well-structured real assets can be a prudent, resilient component of a long-term wealth strategy, and understanding metrics like the cap rate is the first step toward making informed decisions.


At Stiltsville Capital, we look past the surface-level numbers to underwrite opportunities with the discipline and depth of an institutional investor. If you're an accredited investor looking for access to curated commercial real estate deals in high-growth markets, we should talk.


Schedule a confidential call with our team to explore if our offerings are the right fit for your portfolio.


Information presented is for educational purposes only and does not constitute an offer to sell or a solicitation of an offer to buy securities. Any offering is made only through definitive offering documents (e.g., private placement memorandum, subscription agreement) and is available solely to investors who meet applicable suitability standards, including “Accredited Investor” status under Rule 501 of Regulation D. Investments in private real estate involve risk, including loss of capital, illiquidity, and no guarantee of distributions. Past performance is not indicative of future results. Verification of accredited status is required for participation in Rule 506(c) offerings.


Corporate Office

30 West Mashta Drive | Suite 400

Key Biscayne, FL 33149​​

Tel: 786.316.9840

© 2025 Stiltsville Capital LLC

Stiltsville Capital LLC_logo_black

Disclosures

​​​Success Stories and Testimonials are intended to demonstrate our firms professional experience and history of providing exceptional service to their clients and reflect the collective experience of Stiltsville Capital, LLC's Principals and Team members and may include transactions/clients they have worked with directly at previous firms.

Stiltsville Capital, LLC and its affiliates do not provide tax or legal advice. Information contained on this website is provided for educational and illustrative purposes only and cannot be relied upon to avoid tax penalties. Please consult your tax and legal advisors to determine how this information may apply to your own situation. Whether any planned tax result is realized by you depends on the specific facts of your own situation at the time your tax return is filed. 


Real estate and private equity investments have special risks, including possible illiquidity of the underlying properties, credit risk, interest rate fluctuations, and the impact of varied economic conditions and may not be suitable for all investors.

bottom of page